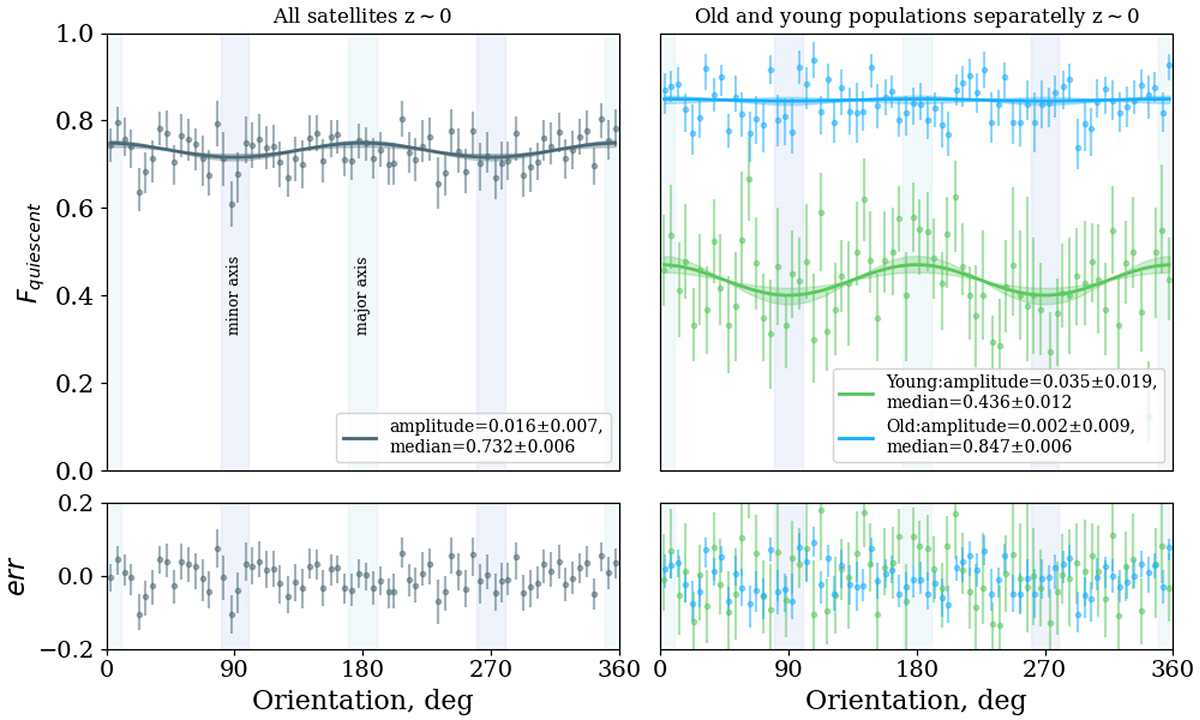
Fig. 3.
Download original image
Modulation of the quiescent fraction of satellite galaxies as a function of orientation with respect to the major axis of their central galaxy. Symbols with error bars show the median values with 1σ confidence interval in bins of 5 deg. The modulation is fitted by a cosine function, and the amplitude of the modulation and median Fq are indicated in the right bottom corner with a 1σ confidence interval. The shaded zone around the cosine function indicates a 1σ confidence interval in the amplitude fitting. The bottom panels represent the residuals between the data and the fitting. The orientation of the minor and major axes of central galaxies is indicated by vertically shaded regions. Left: results for all 8162 satellites log10[M⋆/M⊙] > 8 inside R200 at z ∼ 0. The marginal distributions of the fitting parameters are shown in Fig. D.1. Right: same, but for young (green line) and old (blue line) satellites separately. The corresponding marginal distributions of the fitting parameters are shown in Figs. D.2 and D.3.
Current usage metrics show cumulative count of Article Views (full-text article views including HTML views, PDF and ePub downloads, according to the available data) and Abstracts Views on Vision4Press platform.
Data correspond to usage on the plateform after 2015. The current usage metrics is available 48-96 hours after online publication and is updated daily on week days.
Initial download of the metrics may take a while.