Fig. 1.
Download original image
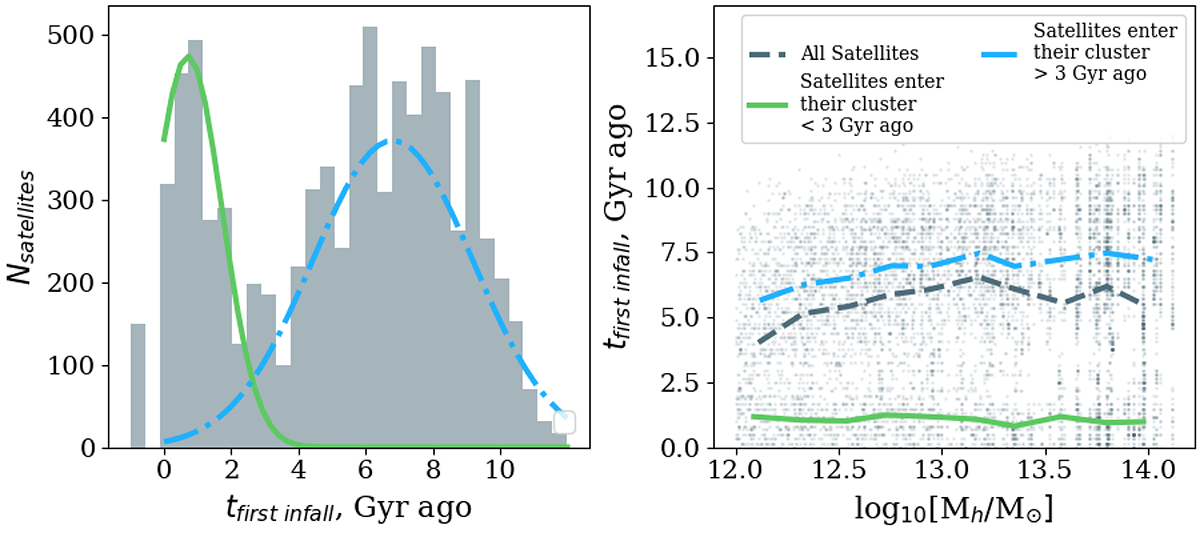
First infall time of satellite progenitors onto their host-group progenitor (see text for details). Left: probability distribution function of tfirst infall. The Gaussians illustrate the presence of two populations of satellites: those whose progenitors first entered before 3 Gyr ago (old population, in blue) and those whose progenitors first entered in the last 3 Gyr (young population, in green). Negative values represent satellites whose first infall time could not be computed (empty merger tree for low-mass subhalos, near the resolution limit, for instance). Right: first infall time as a function of host halo mass Mhalo at z ∼ 0. Lines represent the median values for the old (blue line), total (grey line), and young (green line) populations of satellites.
Current usage metrics show cumulative count of Article Views (full-text article views including HTML views, PDF and ePub downloads, according to the available data) and Abstracts Views on Vision4Press platform.
Data correspond to usage on the plateform after 2015. The current usage metrics is available 48-96 hours after online publication and is updated daily on week days.
Initial download of the metrics may take a while.