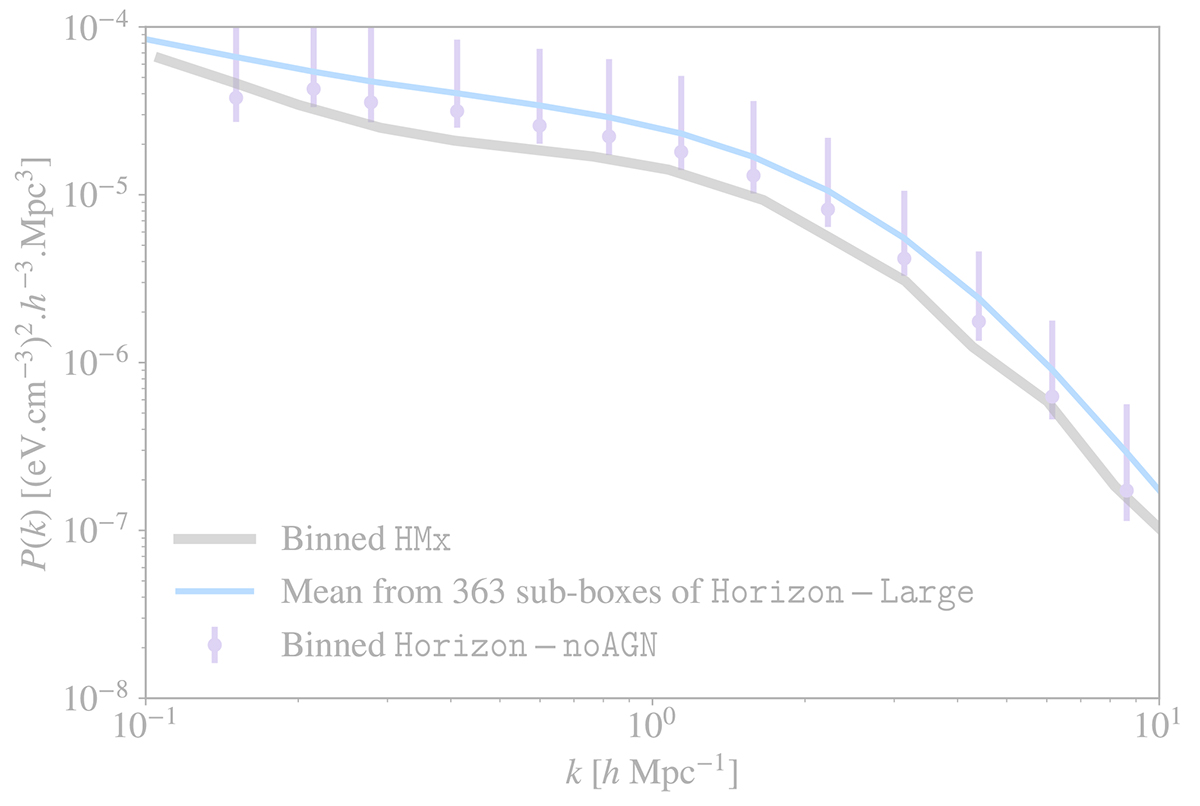
Fig. 9.
Download original image
Pressure auto-power spectrum in Horizon-noAGN in purple compared to HMx in dark grey and the mean over 363 sub-boxes of 100 h−1 Mpc from the Horizon-Large in blue. The purple error bars contain 68% around the mean of the 363 sub-boxes of the Horizon-Large (see the text for more information). They are applied to the Horizon-noAGN simulations to represent its variance.
Current usage metrics show cumulative count of Article Views (full-text article views including HTML views, PDF and ePub downloads, according to the available data) and Abstracts Views on Vision4Press platform.
Data correspond to usage on the plateform after 2015. The current usage metrics is available 48-96 hours after online publication and is updated daily on week days.
Initial download of the metrics may take a while.