Fig. 8.
Download original image
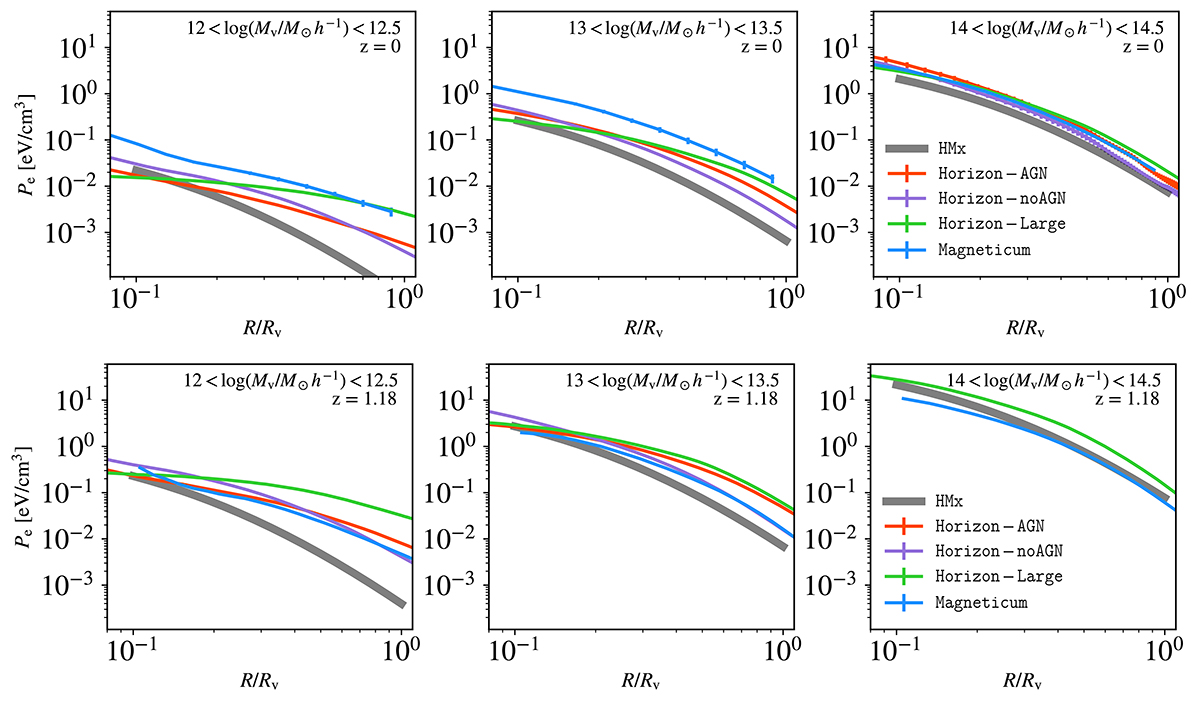
Pressure profile as a function of the distance to the centre of the halos compared with the one predicted by HMx in dark grey at z = 0 (first row) and z = 1.18 (second row). Each panel represents a different mass bin and each colour is a different simulation: Horizon-AGN in red, Horizon-noAGN in purple, Horizon-Large in green, and Magneticum in blue. The error bars represent the error on the mean and are most of the time too small to be visible.
Current usage metrics show cumulative count of Article Views (full-text article views including HTML views, PDF and ePub downloads, according to the available data) and Abstracts Views on Vision4Press platform.
Data correspond to usage on the plateform after 2015. The current usage metrics is available 48-96 hours after online publication and is updated daily on week days.
Initial download of the metrics may take a while.