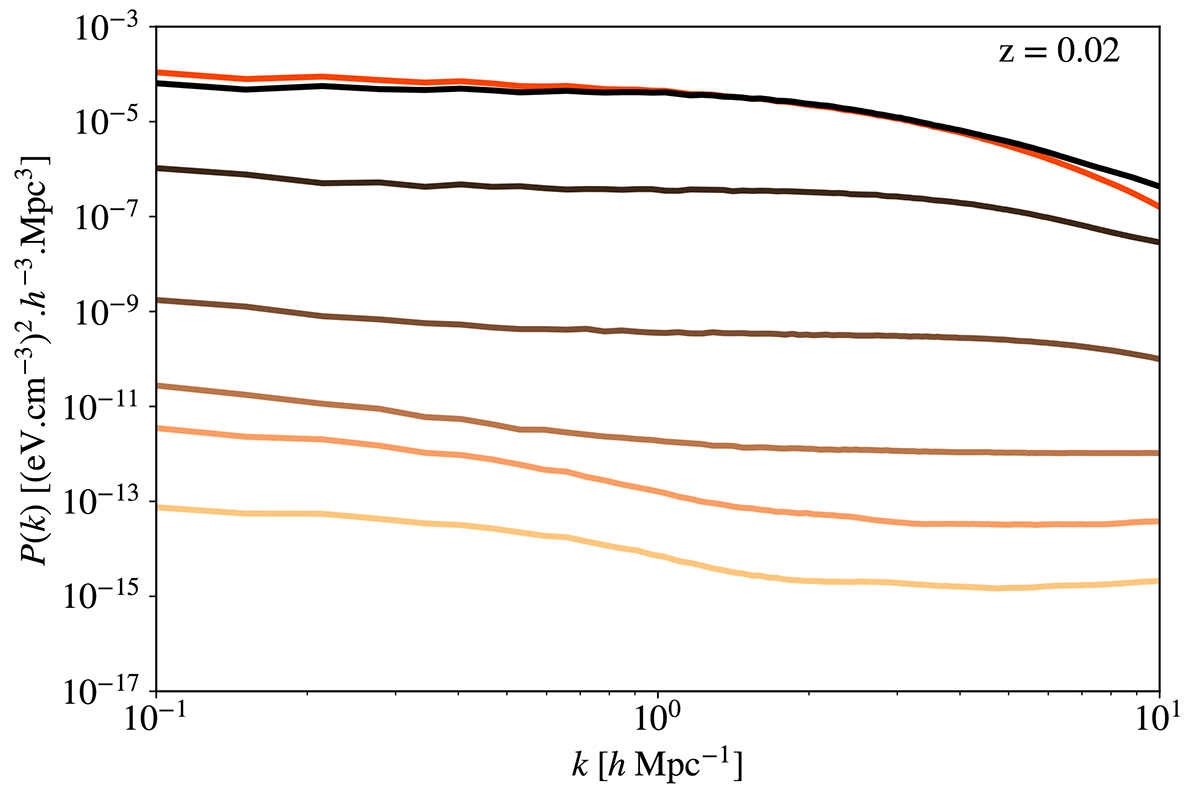
Fig. 7.
Download original image
Pressure auto-power spectrum of the total Horizon-AGN simulation in red compared to the signal coming from within one virial radius of different mass bin. The highest mass bin is in dark brown and corresponds to the mass bin 14 < log(Mv/M⊙ h−1) < 15, we then decrease of one dex for every curve until reaching the lowest mass bin in yellow, which corresponds to the mass bin log(Mv/M⊙ h−1) < 10.
Current usage metrics show cumulative count of Article Views (full-text article views including HTML views, PDF and ePub downloads, according to the available data) and Abstracts Views on Vision4Press platform.
Data correspond to usage on the plateform after 2015. The current usage metrics is available 48-96 hours after online publication and is updated daily on week days.
Initial download of the metrics may take a while.