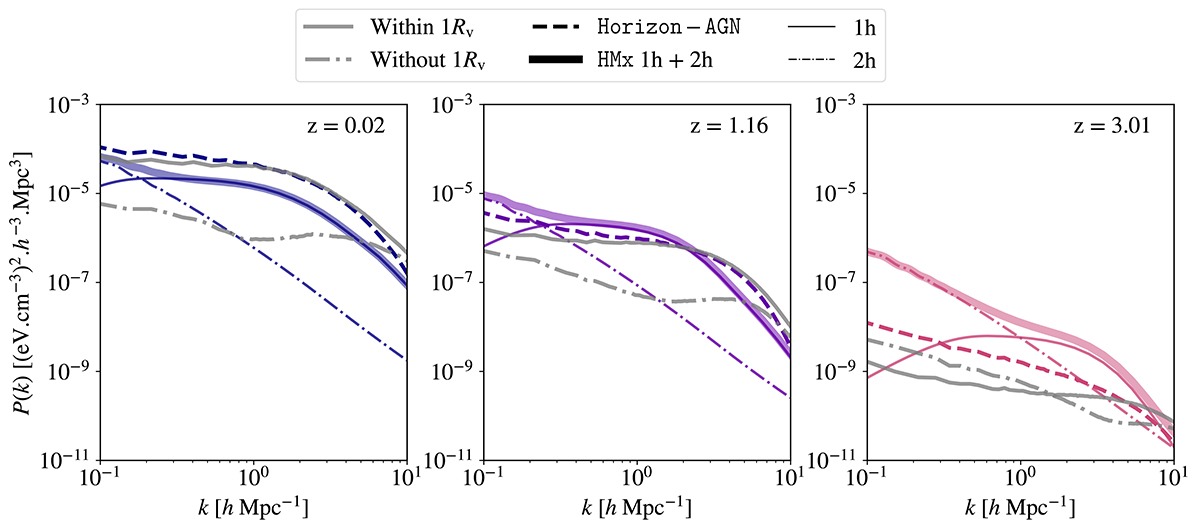
Fig. 6.
Download original image
Pressure auto-power spectrum as a function of redshift in the different panels. For every redshift, we show the power spectrum of Horizon-AGN in a coloured dashed line, the HMx prediction in a coloured full line, the predicted one-halo term in a coloured thin line, and the predicted two-halo term in a coloured dotted-dashed line. We superimpose the pressure auto-power spectrum within (without) one virial radius in a grey full line (grey dotted-dashed line). On the left, we show the result for z = 0.02, on the middle for z = 1.16, and on the right for z = 3.01.
Current usage metrics show cumulative count of Article Views (full-text article views including HTML views, PDF and ePub downloads, according to the available data) and Abstracts Views on Vision4Press platform.
Data correspond to usage on the plateform after 2015. The current usage metrics is available 48-96 hours after online publication and is updated daily on week days.
Initial download of the metrics may take a while.