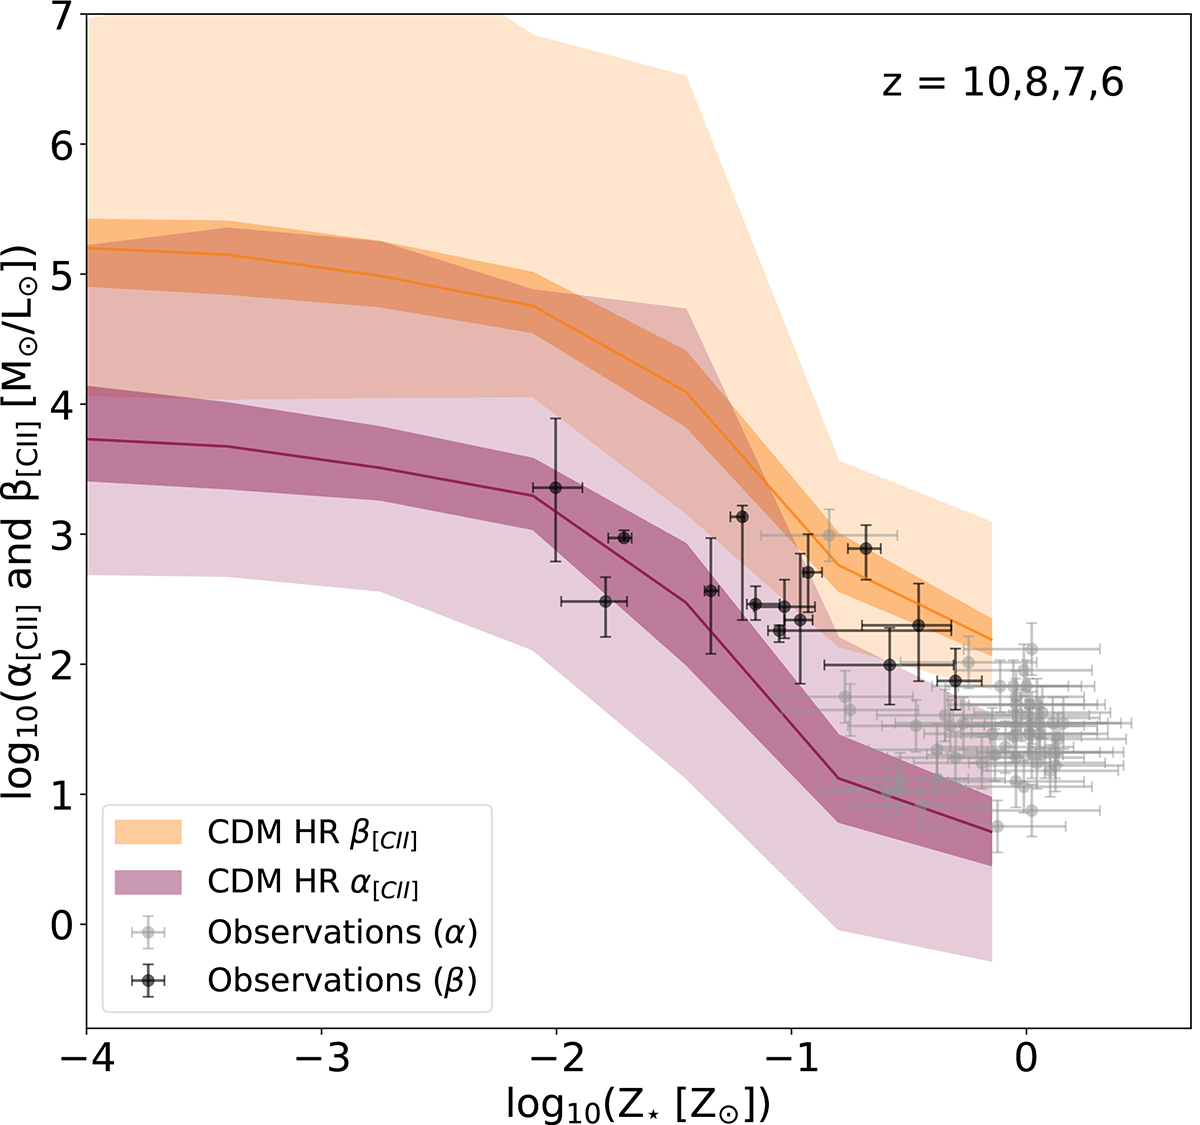
Fig. 4.
Download original image
L[C II]-to-MH2 conversion factor α[CII] (dark pink) and L[C II]-to-MHI conversion factor β[CII] (orange) as a function of stellar metallicity Z⋆, at z = 10, 8, 7, and 6 combined. The solid dark pink and orange lines represent the mean values obtained from CDM HR for α[C II] and β[C II], respectively. The darker (lighter) shaded regions represent the 1σ (2σ) standard deviation. The grey points are α[C II] estimates from observations of local galaxies (Cormier et al. 2015; Accurso et al. 2017; Contursi et al. 2017; Hughes et al. 2017) and z = 2 − 4 galaxies (Huynh et al. 2014; Schaerer et al. 2015). The black squares are β[C II] derived by observations of γ-ray burst afterglows in star-forming galaxies at z = 2 − 5 (Heintz et al. 2021). The COLDSIM results agree well with lower-redshift observations and provide predictions for future observational works. Both α[C II] and β[C II] increase by ∼3 dex at low stellar metallicities.
Current usage metrics show cumulative count of Article Views (full-text article views including HTML views, PDF and ePub downloads, according to the available data) and Abstracts Views on Vision4Press platform.
Data correspond to usage on the plateform after 2015. The current usage metrics is available 48-96 hours after online publication and is updated daily on week days.
Initial download of the metrics may take a while.