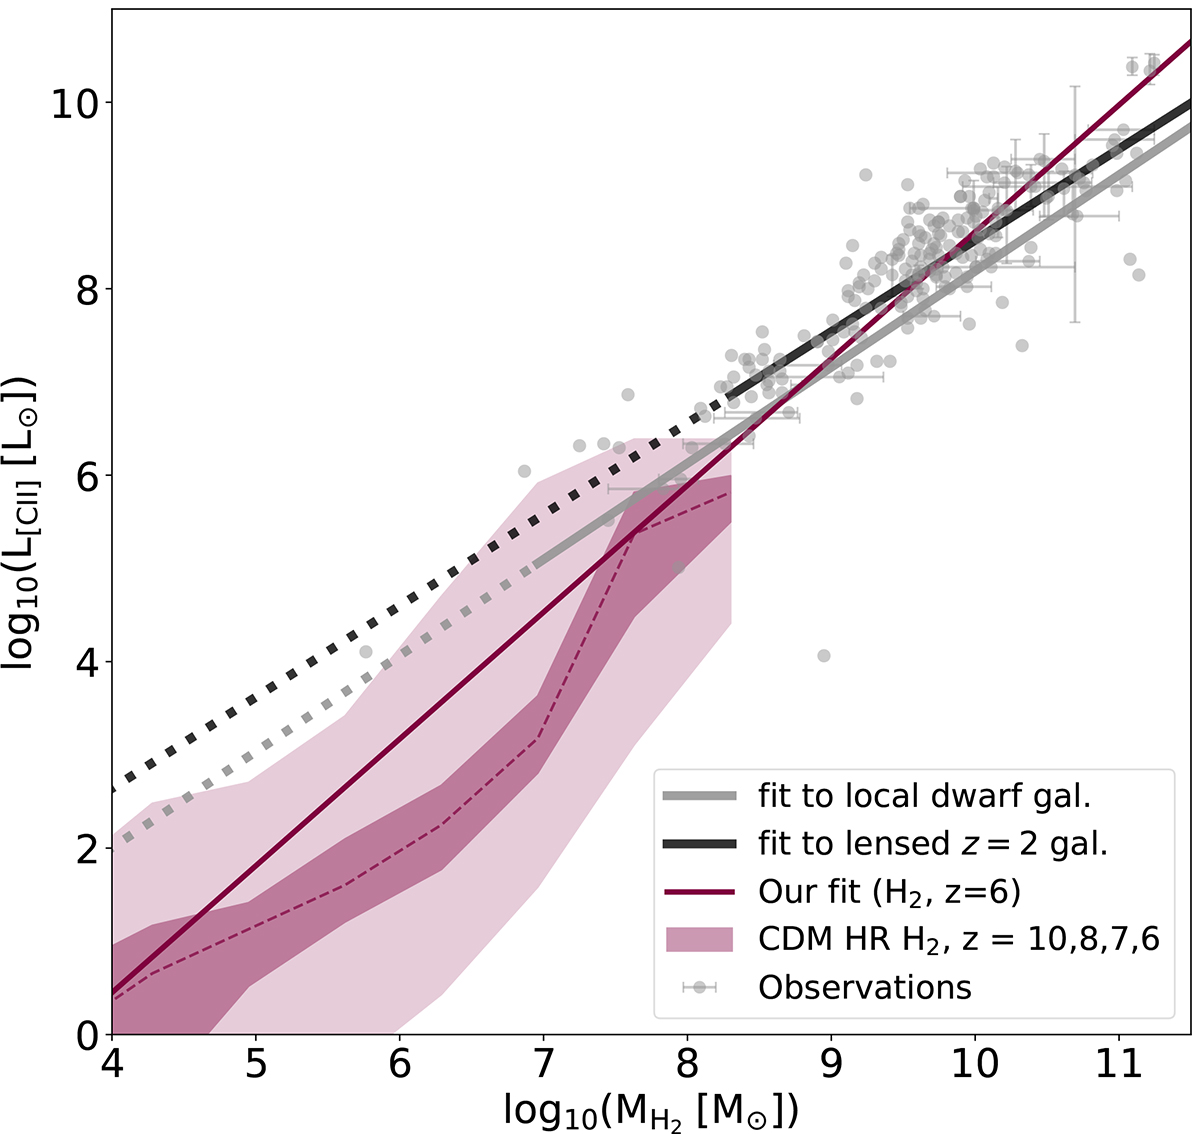
Fig. 3.
Download original image
[C II] luminosity L[C II] as a function of H2 mass MH2 at z = 10, 8, 7, and 6 combined. The dashed line refers to the mean value for CDM HR (dark pink), and the darker (lighter) shaded region represents the 1σ (2σ) standard deviation. The solid dark pink line represents the linear fit to the CDM HR results at z = 6. The solid black and grey lines refer to the fits to observations by Zanella et al. (2018) and Madden et al. (2020), and the extrapolations of the fits to lower luminosities are highlighted with dotted lines. The grey dots represent observations of local dwarf galaxies (Cormier et al. 2015; Madden et al. 2020), z = 0.5 main-sequence and starburst galaxies (Stacey et al. 1991; Díaz-Santos et al. 2013, 2017; Magdis et al. 2014; Accurso et al. 2017; Contursi et al. 2017; Hughes et al. 2017), and star-forming galaxies in the range z = 2 − 6 (Ferkinhoff et al. 2014; Huynh et al. 2014; Capak et al. 2015; Gullberg et al. 2015; Schaerer et al. 2015; Zanella et al. 2018; Kaasinen et al. 2024). Globally, we find that our simulations agree well with observations.
Current usage metrics show cumulative count of Article Views (full-text article views including HTML views, PDF and ePub downloads, according to the available data) and Abstracts Views on Vision4Press platform.
Data correspond to usage on the plateform after 2015. The current usage metrics is available 48-96 hours after online publication and is updated daily on week days.
Initial download of the metrics may take a while.