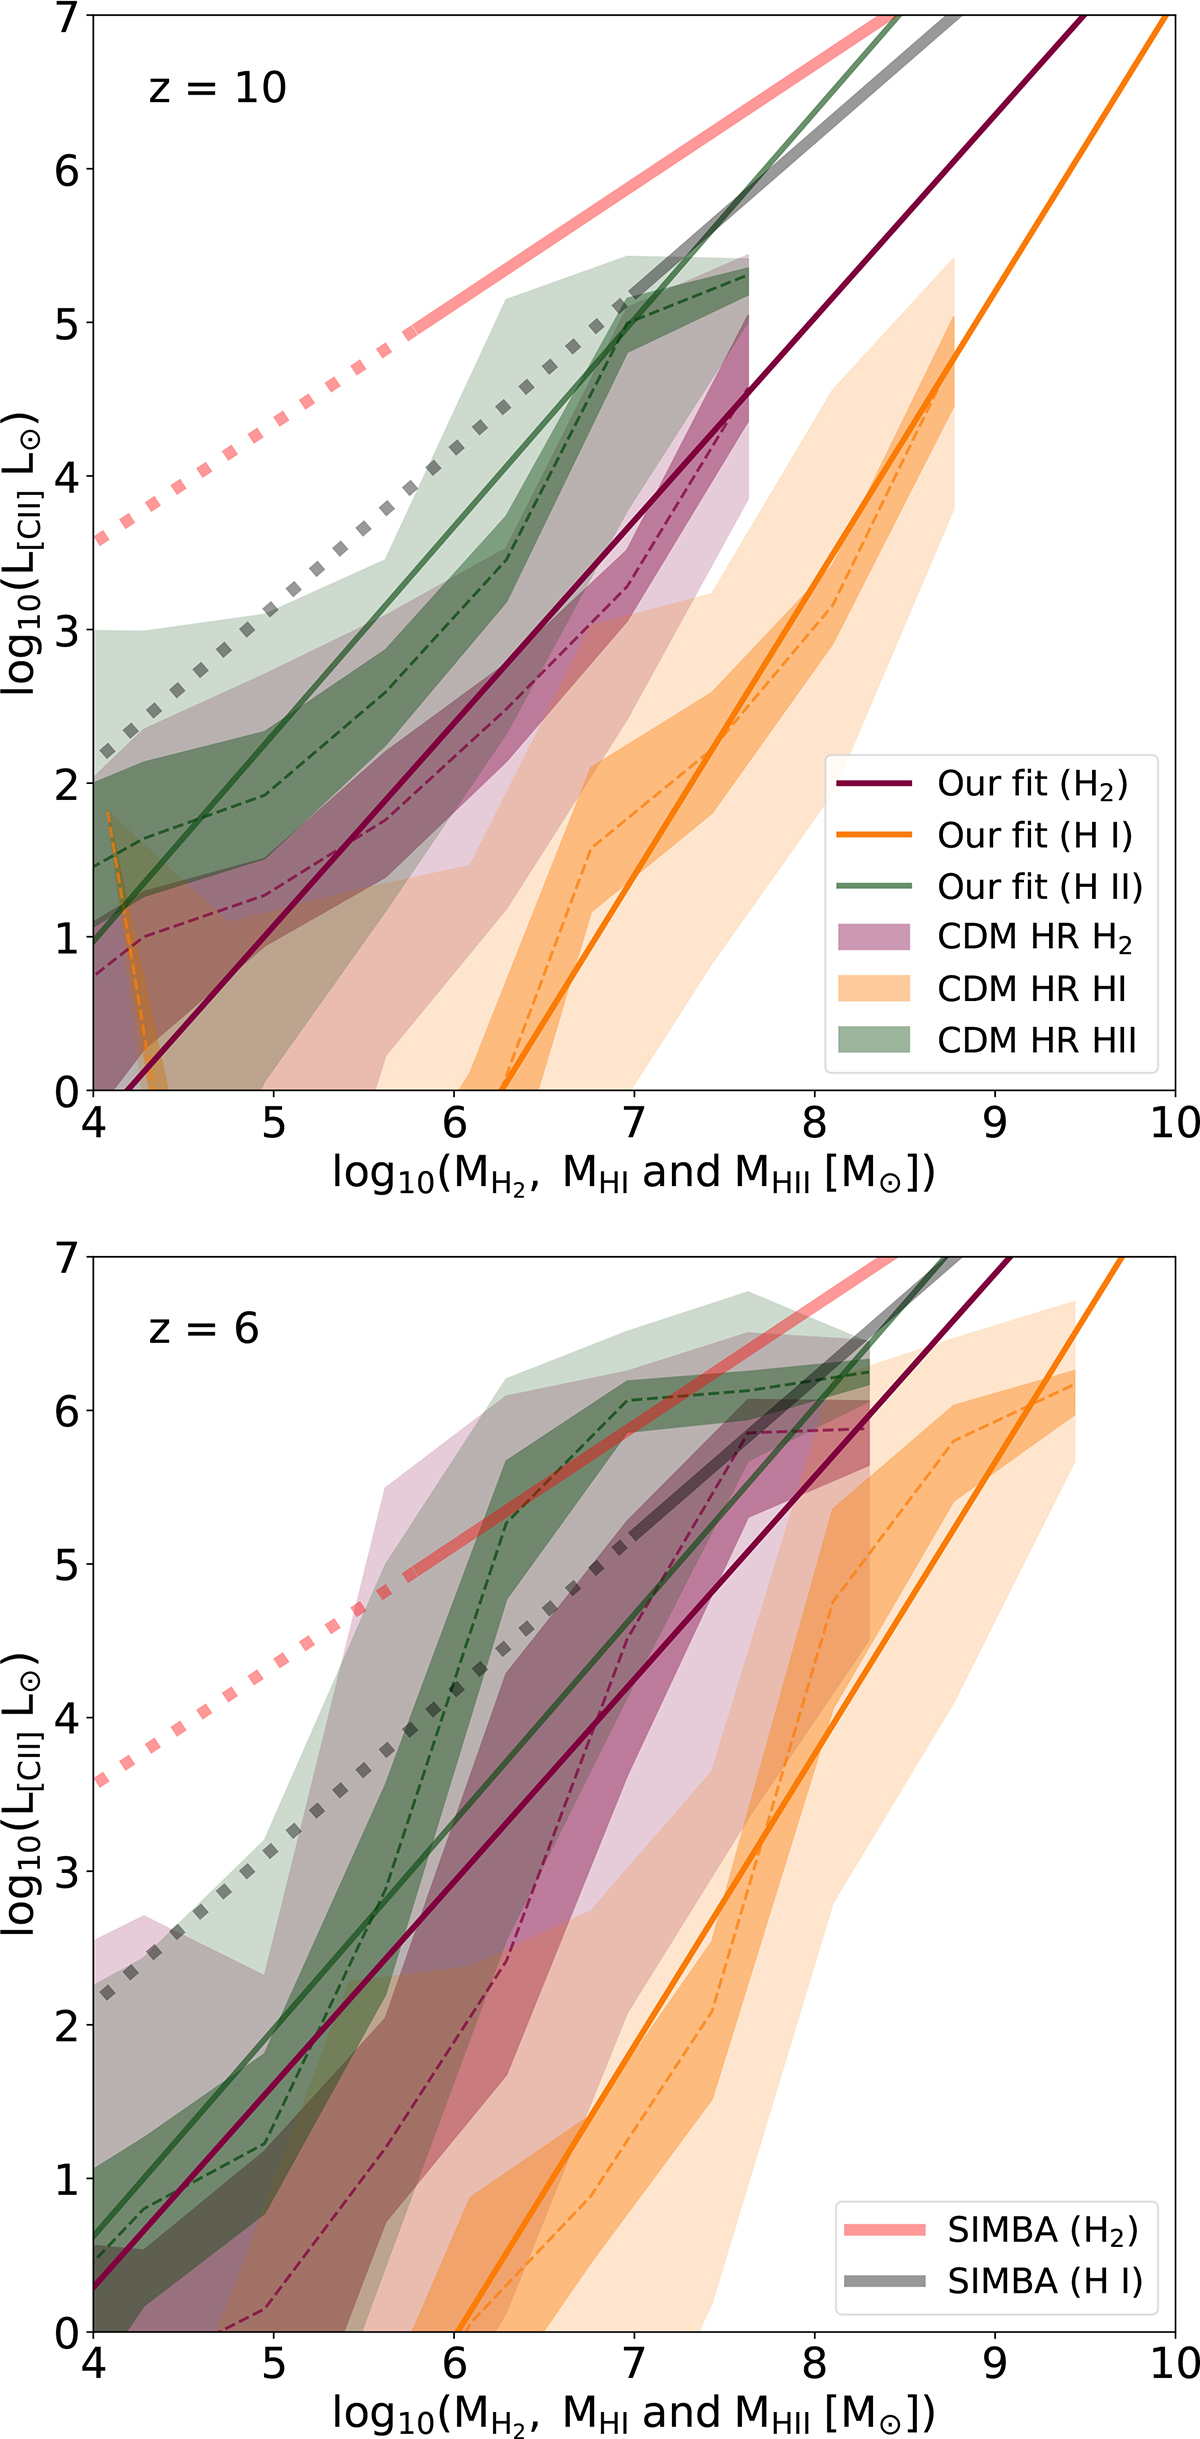
Fig. 2.
Download original image
[C II] luminosity L[C II] as a function of H2 mass MH2 (dark pink), H I mass MHI (orange), and H II mass MHII (green) at z = 10 (top) and 6 (bottom). The dashed lines show the median value for CDM HR, and the darker (lighter) shaded regions represent the 1σ (2σ) standard deviation. The solid dark pink line represents the fit to the CDM HR results for MH2, the solid orange line shows the fit for MHI, and the green line shows MHII (see the text). The solid red and black lines show the linear fit to post-processed SIMBA simulations for MH2 and MHI in their validity range (see Vizgan et al. 2022a,b), and the extrapolations of the fit to lower masses is highlighted with dotted lines. We highlight the redshift evolution of the linear relation between log10(L[C II]) and log10(MH2), log10(MHI), and log10(MHII). Moreover, we find that H I is always the dominant phase for COLDSIM galaxies.
Current usage metrics show cumulative count of Article Views (full-text article views including HTML views, PDF and ePub downloads, according to the available data) and Abstracts Views on Vision4Press platform.
Data correspond to usage on the plateform after 2015. The current usage metrics is available 48-96 hours after online publication and is updated daily on week days.
Initial download of the metrics may take a while.