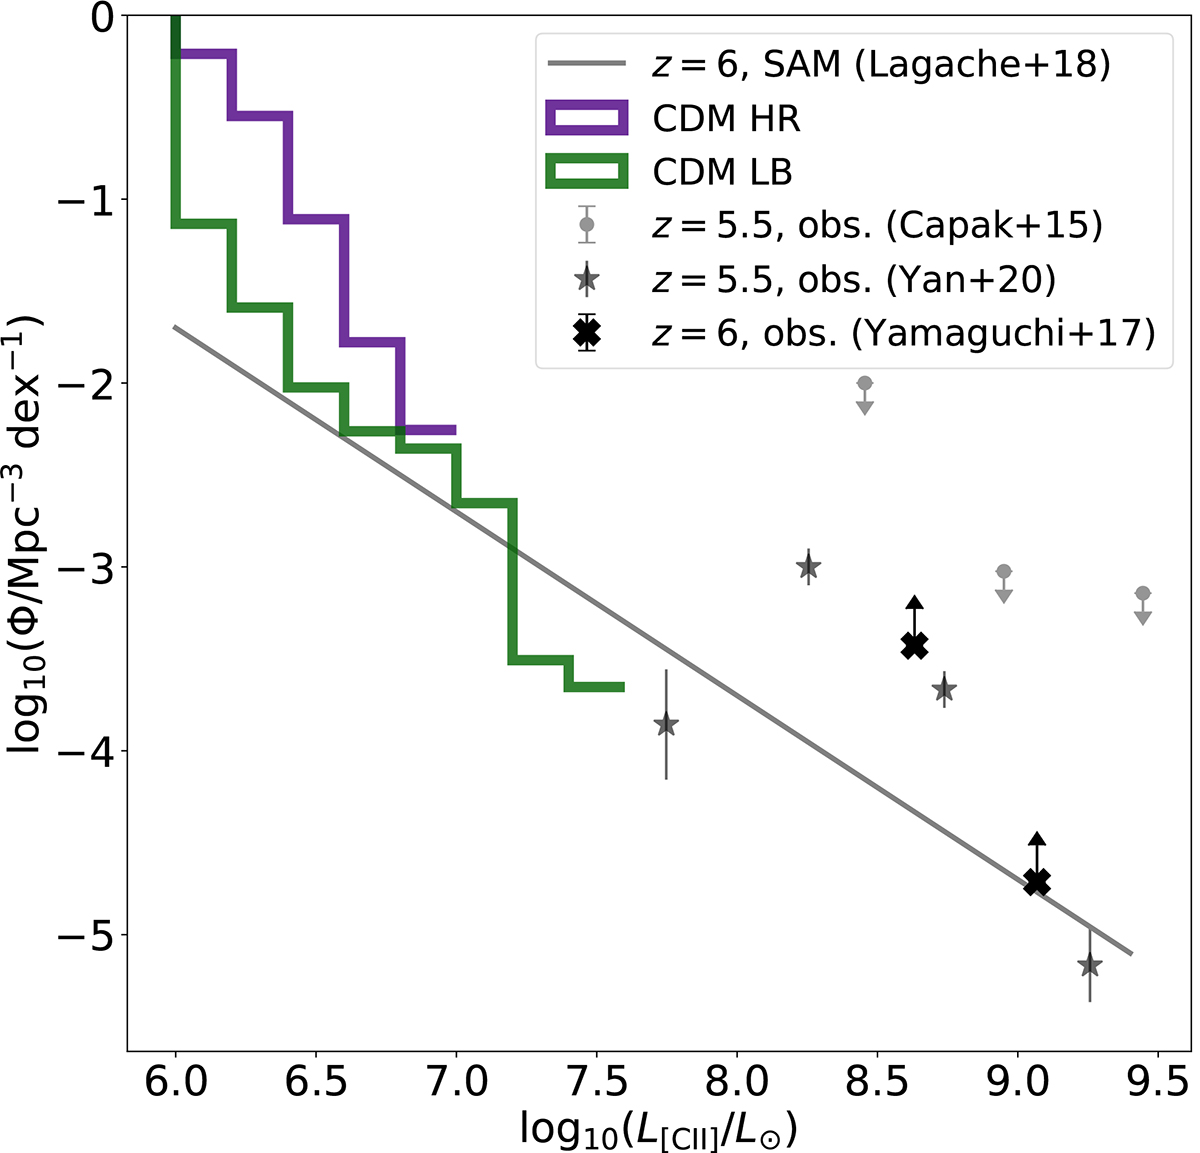
Fig. 1.
Download original image
[C II] luminosity functions at z = 6. The coloured histograms represent predictions from CDM HR (purple) and CDM LB (green). The solid grey line shows the results from the G.A.S. SAM (Lagache et al. 2018). The grey symbols show ALMA data for galaxies at z = 5.5 (dots, Capak et al. 2015), the results from the ALPINE survey (stars, Yan et al. 2020), and lower limits from lensed [C II] line emitters at z = 6 (crosses, Yamaguchi et al. 2017).
Current usage metrics show cumulative count of Article Views (full-text article views including HTML views, PDF and ePub downloads, according to the available data) and Abstracts Views on Vision4Press platform.
Data correspond to usage on the plateform after 2015. The current usage metrics is available 48-96 hours after online publication and is updated daily on week days.
Initial download of the metrics may take a while.