Fig. 5
Download original image
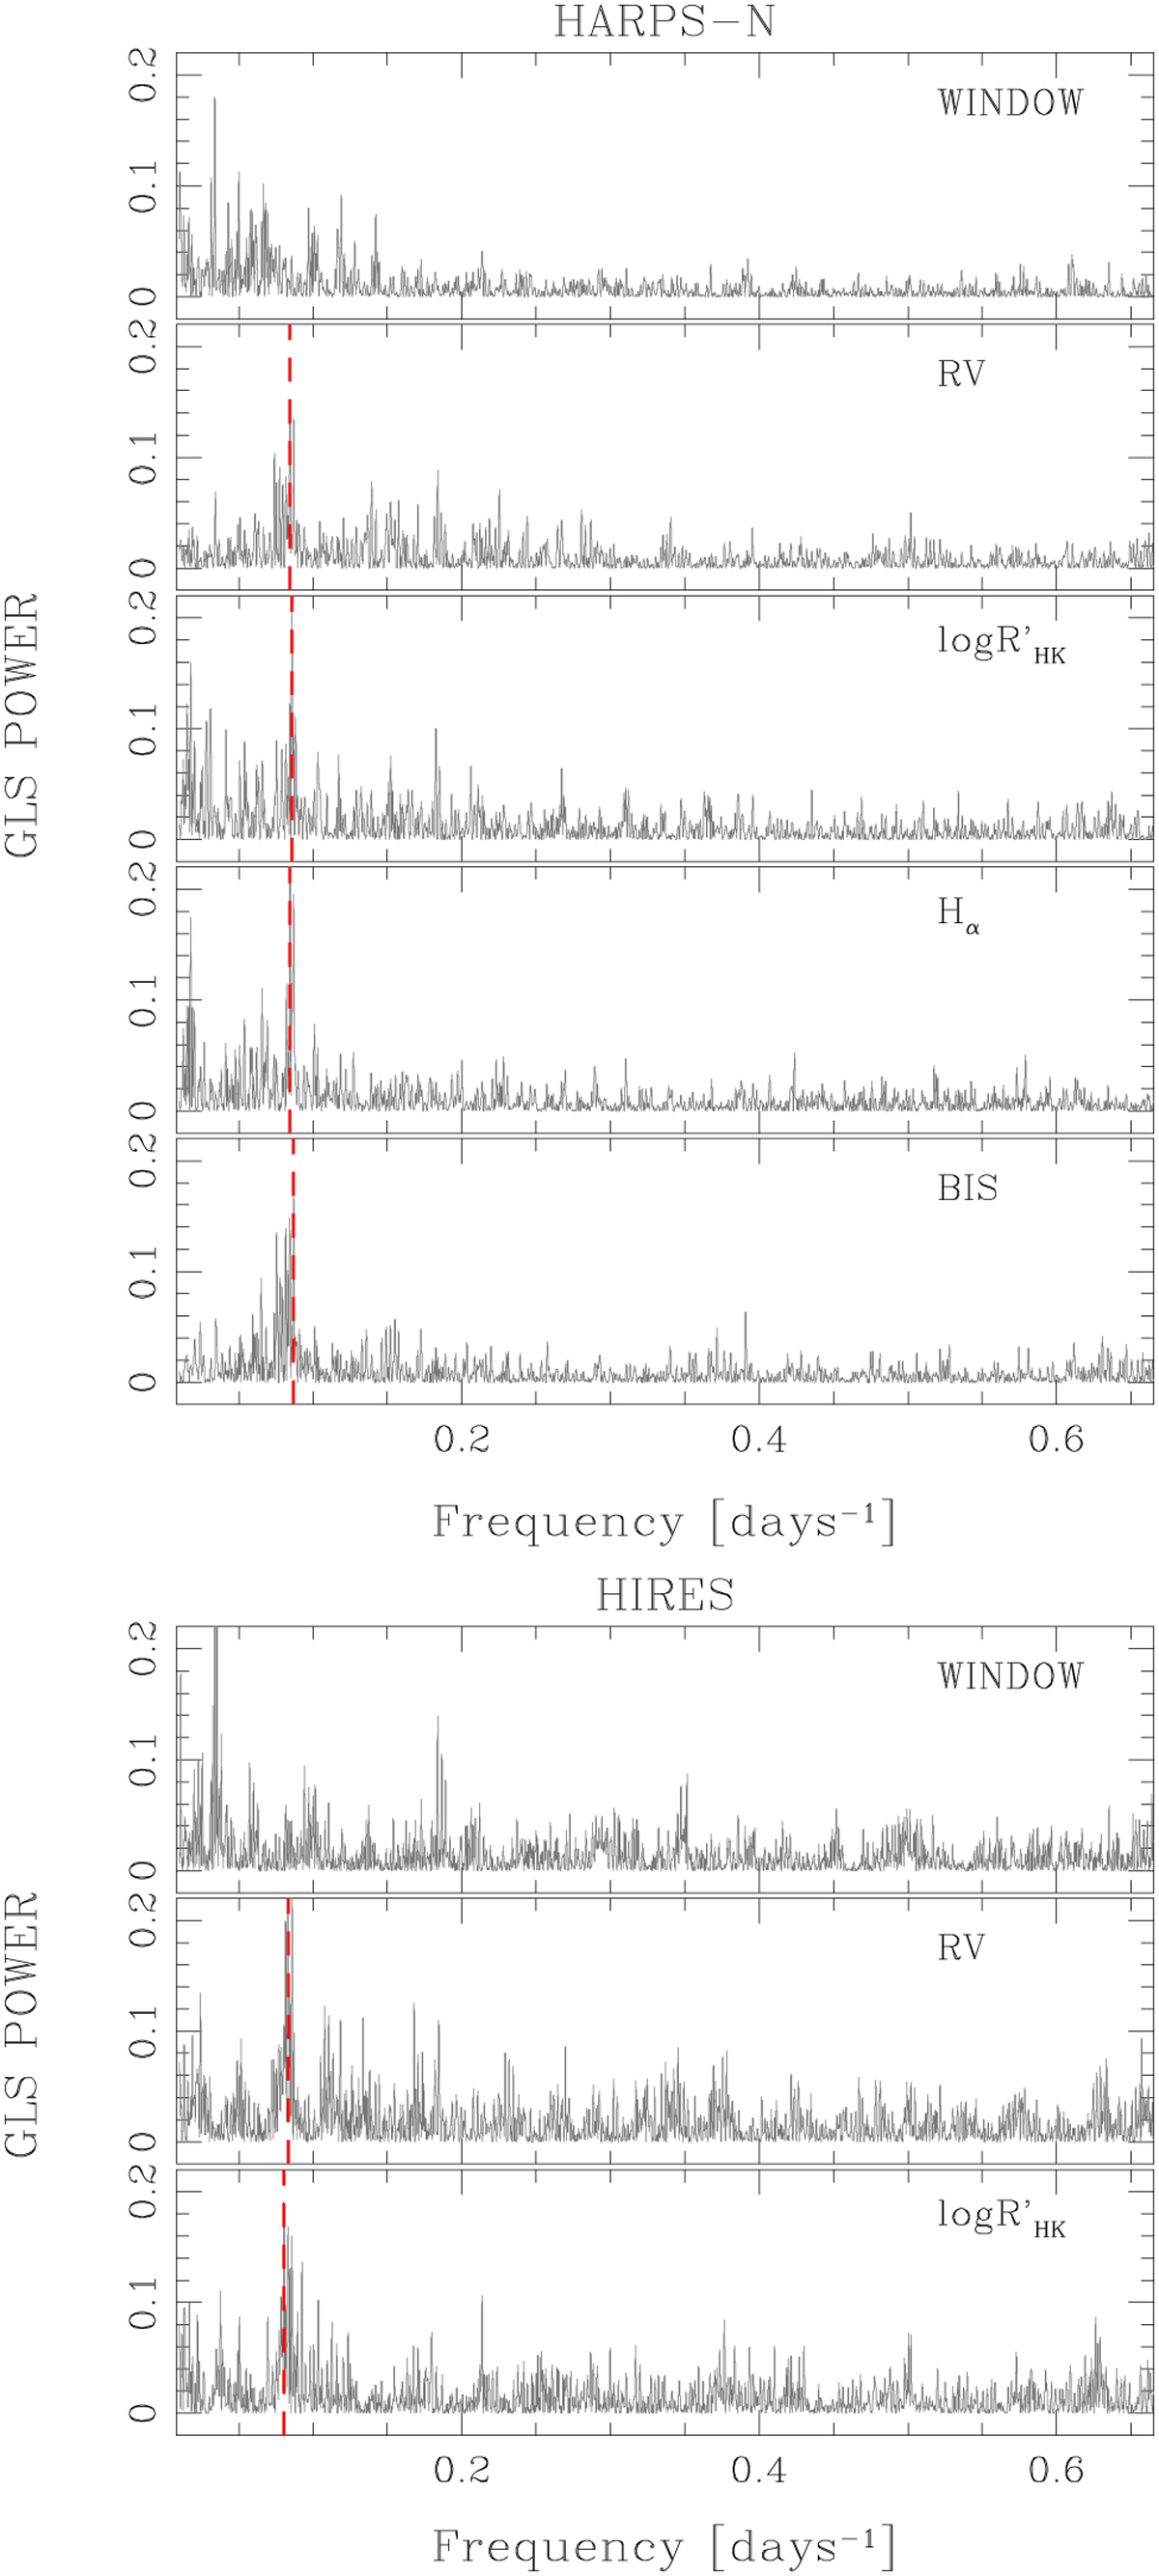
Analysis of the rotation period of TOI-1430 carried out on the HARPS-N (five upper panels) and HIRES (three bottom panels) spectroscopic series shown in Fig. 3 (after the subtraction of the long trend). Panels show the GLS periodograms extracted from the RV, log ![]() , Hα, and BIS time series. Red dashed lines indicate the frequency of the peak. The window function periodograms are also reported.
, Hα, and BIS time series. Red dashed lines indicate the frequency of the peak. The window function periodograms are also reported.
Current usage metrics show cumulative count of Article Views (full-text article views including HTML views, PDF and ePub downloads, according to the available data) and Abstracts Views on Vision4Press platform.
Data correspond to usage on the plateform after 2015. The current usage metrics is available 48-96 hours after online publication and is updated daily on week days.
Initial download of the metrics may take a while.