Open Access
Fig. F.1
Download original image
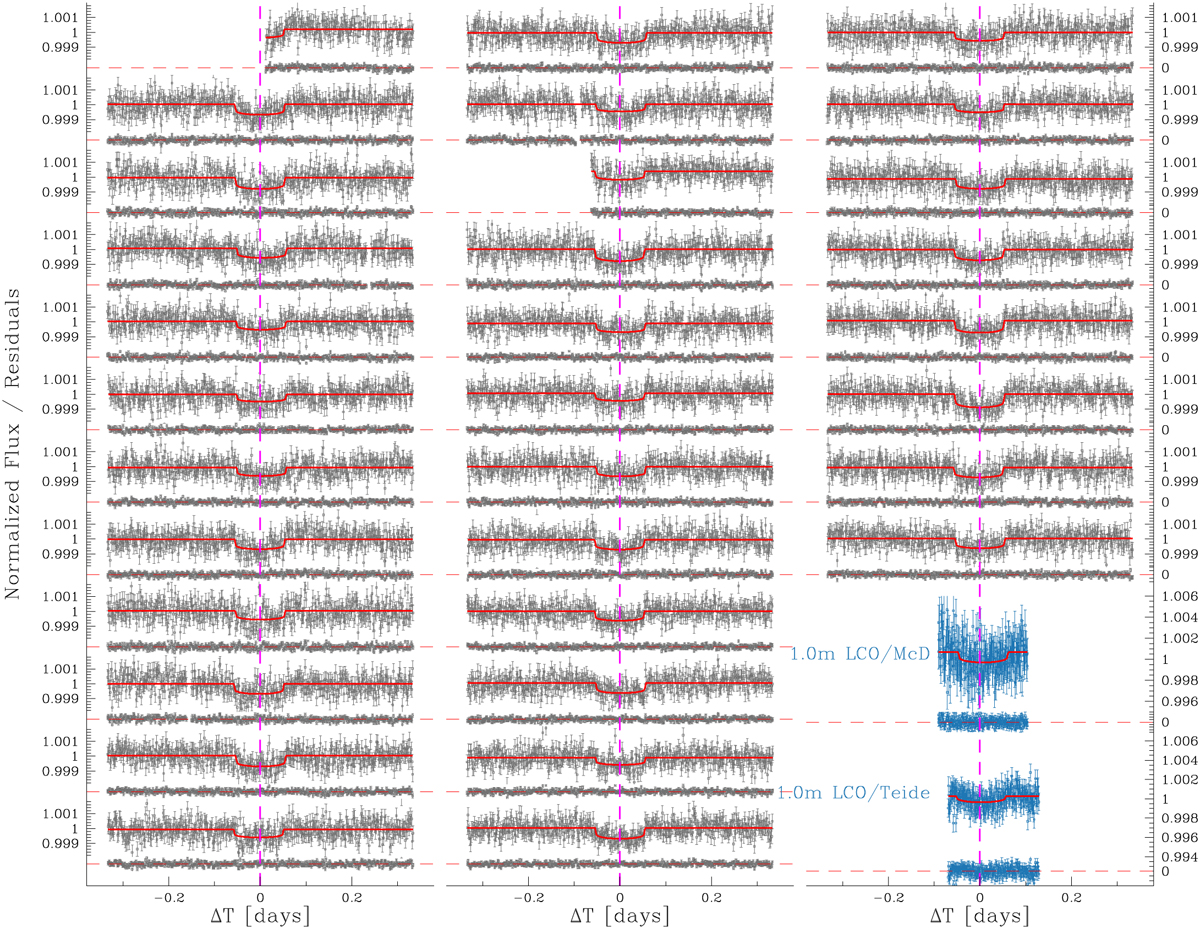
Analysis of TTVs based on TESS (gray points) and LCO (azure points) data. Panels shows every single transit centred on the expected T0 (magenta dashed line) and the fitted model (in red). Below each transit, the residuals are reported.
Current usage metrics show cumulative count of Article Views (full-text article views including HTML views, PDF and ePub downloads, according to the available data) and Abstracts Views on Vision4Press platform.
Data correspond to usage on the plateform after 2015. The current usage metrics is available 48-96 hours after online publication and is updated daily on week days.
Initial download of the metrics may take a while.