Fig. 8
Download original image
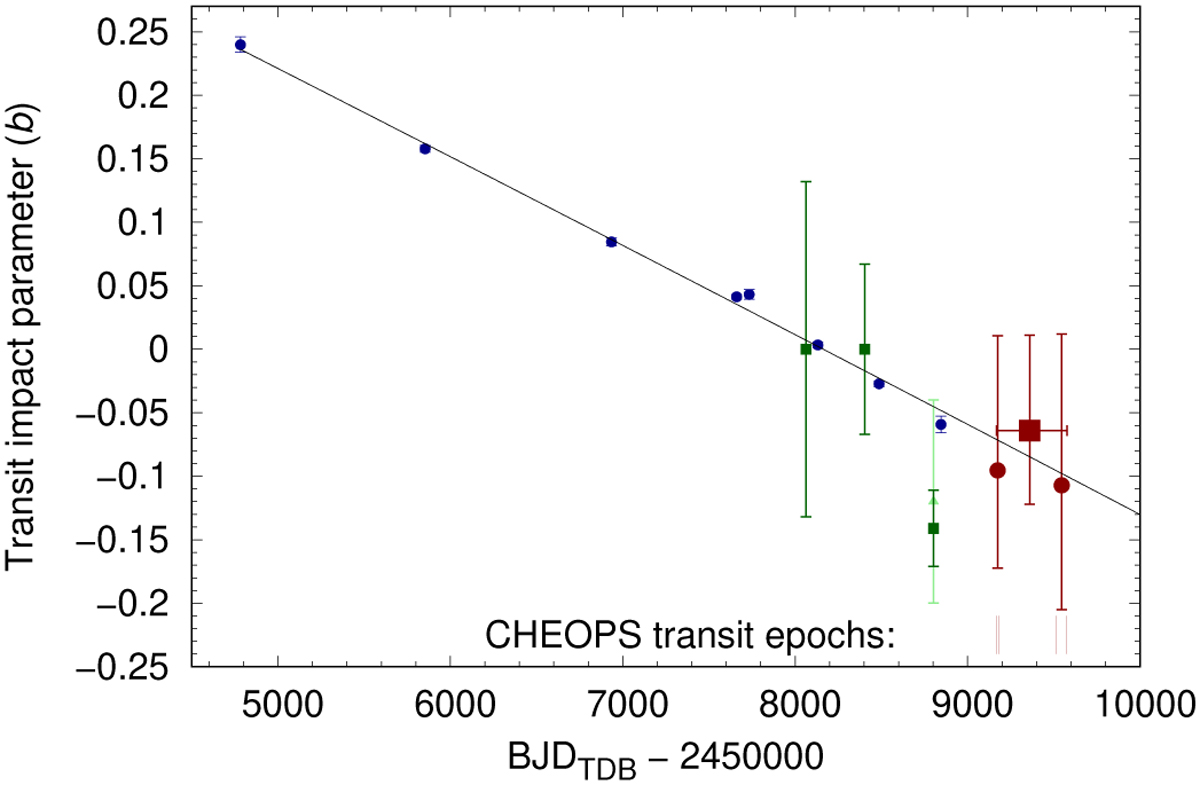
Impact parameter as a function of time. Doppler tomographic measurements (from Watanabe et al. 2022) are shown in dark blue, previously published photometric measurements are shown in green, with the two at the same epoch taken from Dholakia et al. (2022) (light green) and Kálmán et al. (2022) (dark green). Our CHEOPS measurements are shown in dark red, with the result from the fit to all four transits indicated by a square, and the fits to each pair of transits by circles. The epochs of our four CHEOPS transits are shown with short red vertical lines just above the abscissa. The solid black line is the nodal precession model presented in Watanabe et al. (2022).
Current usage metrics show cumulative count of Article Views (full-text article views including HTML views, PDF and ePub downloads, according to the available data) and Abstracts Views on Vision4Press platform.
Data correspond to usage on the plateform after 2015. The current usage metrics is available 48-96 hours after online publication and is updated daily on week days.
Initial download of the metrics may take a while.