Open Access
Fig. 7
Download original image
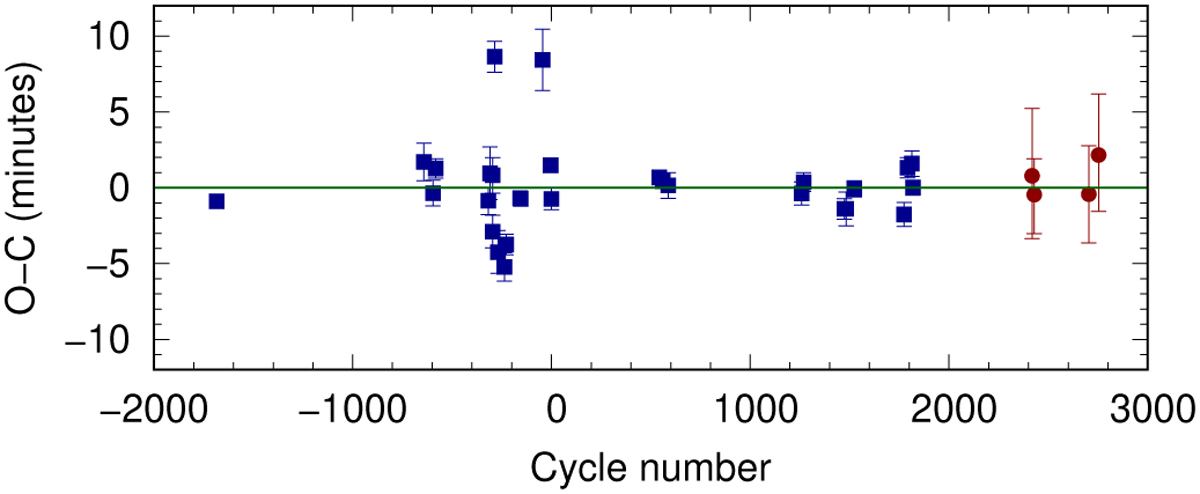
Transit timings compared to a linear ephemeris. The archival points collated by Ivshina & Winn (2022) are shown with blue squares, relative to their linear ephemeris. The timing of our CHEOPS transits are indicated with red circles.
Current usage metrics show cumulative count of Article Views (full-text article views including HTML views, PDF and ePub downloads, according to the available data) and Abstracts Views on Vision4Press platform.
Data correspond to usage on the plateform after 2015. The current usage metrics is available 48-96 hours after online publication and is updated daily on week days.
Initial download of the metrics may take a while.