Fig. 6
Download original image
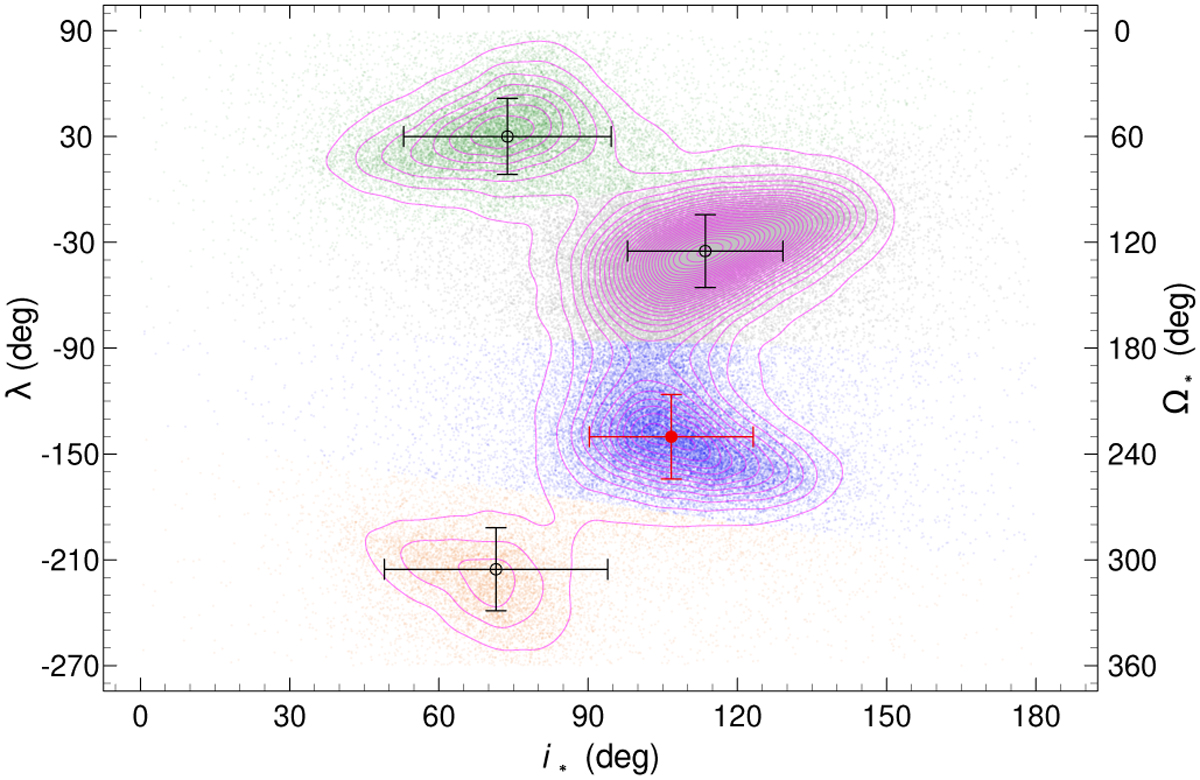
Posterior distribution of Ω★ (equivalently λ) and i★, for a fit with fitting ranges 0° < i★ < 180° and 0° < Ω★ < 360°. A clustering analysis was performed on the posterior, dividing it into four groups, indicated with different colours. The median and 1σ uncertainties of each group are shown with the open circles and error bars. The red circle is the ‘correct’ solution. Contours indicating the density of the posterior space are shown with magenta lines.
Current usage metrics show cumulative count of Article Views (full-text article views including HTML views, PDF and ePub downloads, according to the available data) and Abstracts Views on Vision4Press platform.
Data correspond to usage on the plateform after 2015. The current usage metrics is available 48-96 hours after online publication and is updated daily on week days.
Initial download of the metrics may take a while.