Fig. 3
Download original image
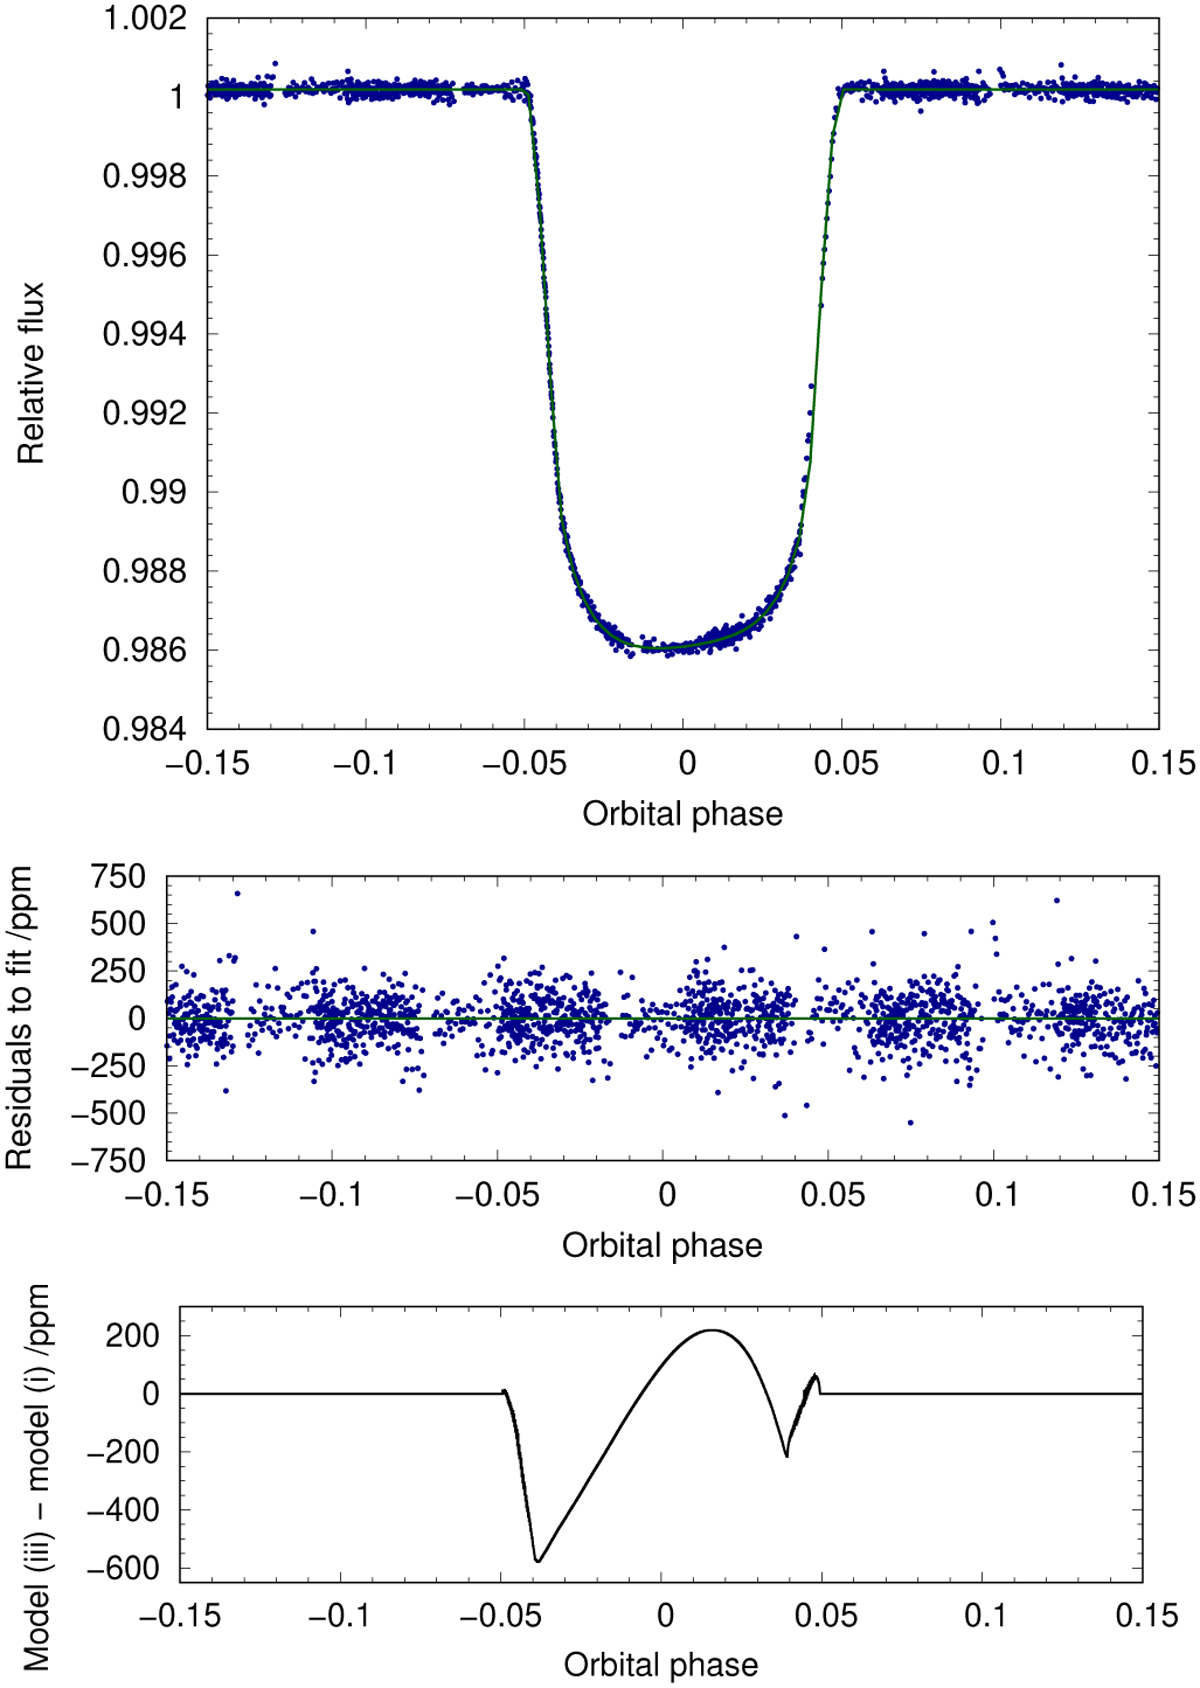
Fit to the transit data. Upper panel: Phase-folded transit light curve (blue points), overplotted with the best-fitting model with fixed Ω★, corresponding to case (iii) of Table 5 (green curve). Middle panel: Residuals to the fit shown in the upper panel. Lower panel: The difference between the best-fitting model shown in the upper panel, and the best-fitting model from case (i), where the gravity-darkening phenomenon is not included in the fit.
Current usage metrics show cumulative count of Article Views (full-text article views including HTML views, PDF and ePub downloads, according to the available data) and Abstracts Views on Vision4Press platform.
Data correspond to usage on the plateform after 2015. The current usage metrics is available 48-96 hours after online publication and is updated daily on week days.
Initial download of the metrics may take a while.