Fig. D.1
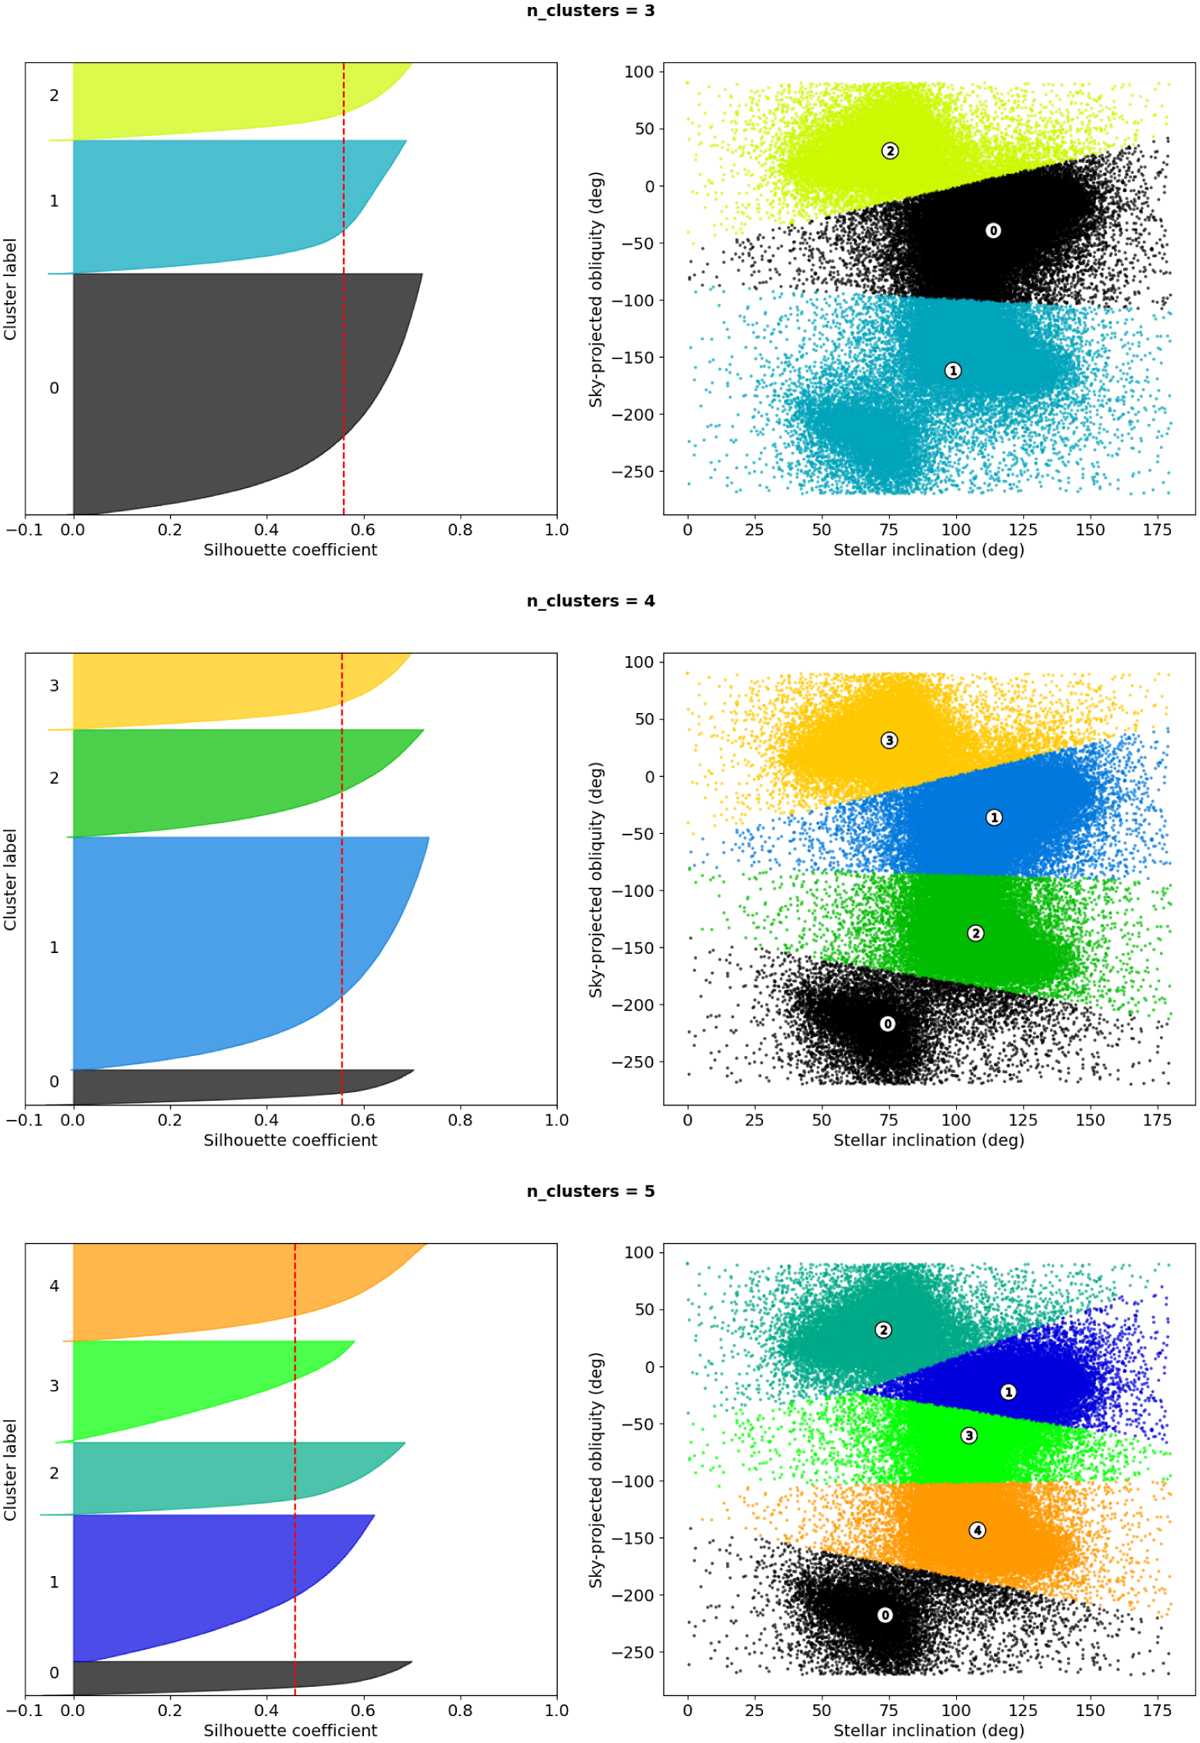
Download original image
Silhouette plots for our cluster analysis of the posterior distribution of Ω★ and i★. Silhouette plots are shown (from top to bottom) for three, four, and five clusters. In each case, the silhouette coefficients are plotted in the left panel, where the silhouette statistic is indicated with a dashed red line. The clusters are shown in λ − i★ space in the right panels, using the same colour coding as in the corresponding left-hand panel. For more details, see Section 7.1.
Current usage metrics show cumulative count of Article Views (full-text article views including HTML views, PDF and ePub downloads, according to the available data) and Abstracts Views on Vision4Press platform.
Data correspond to usage on the plateform after 2015. The current usage metrics is available 48-96 hours after online publication and is updated daily on week days.
Initial download of the metrics may take a while.