Fig. C.1
Download original image
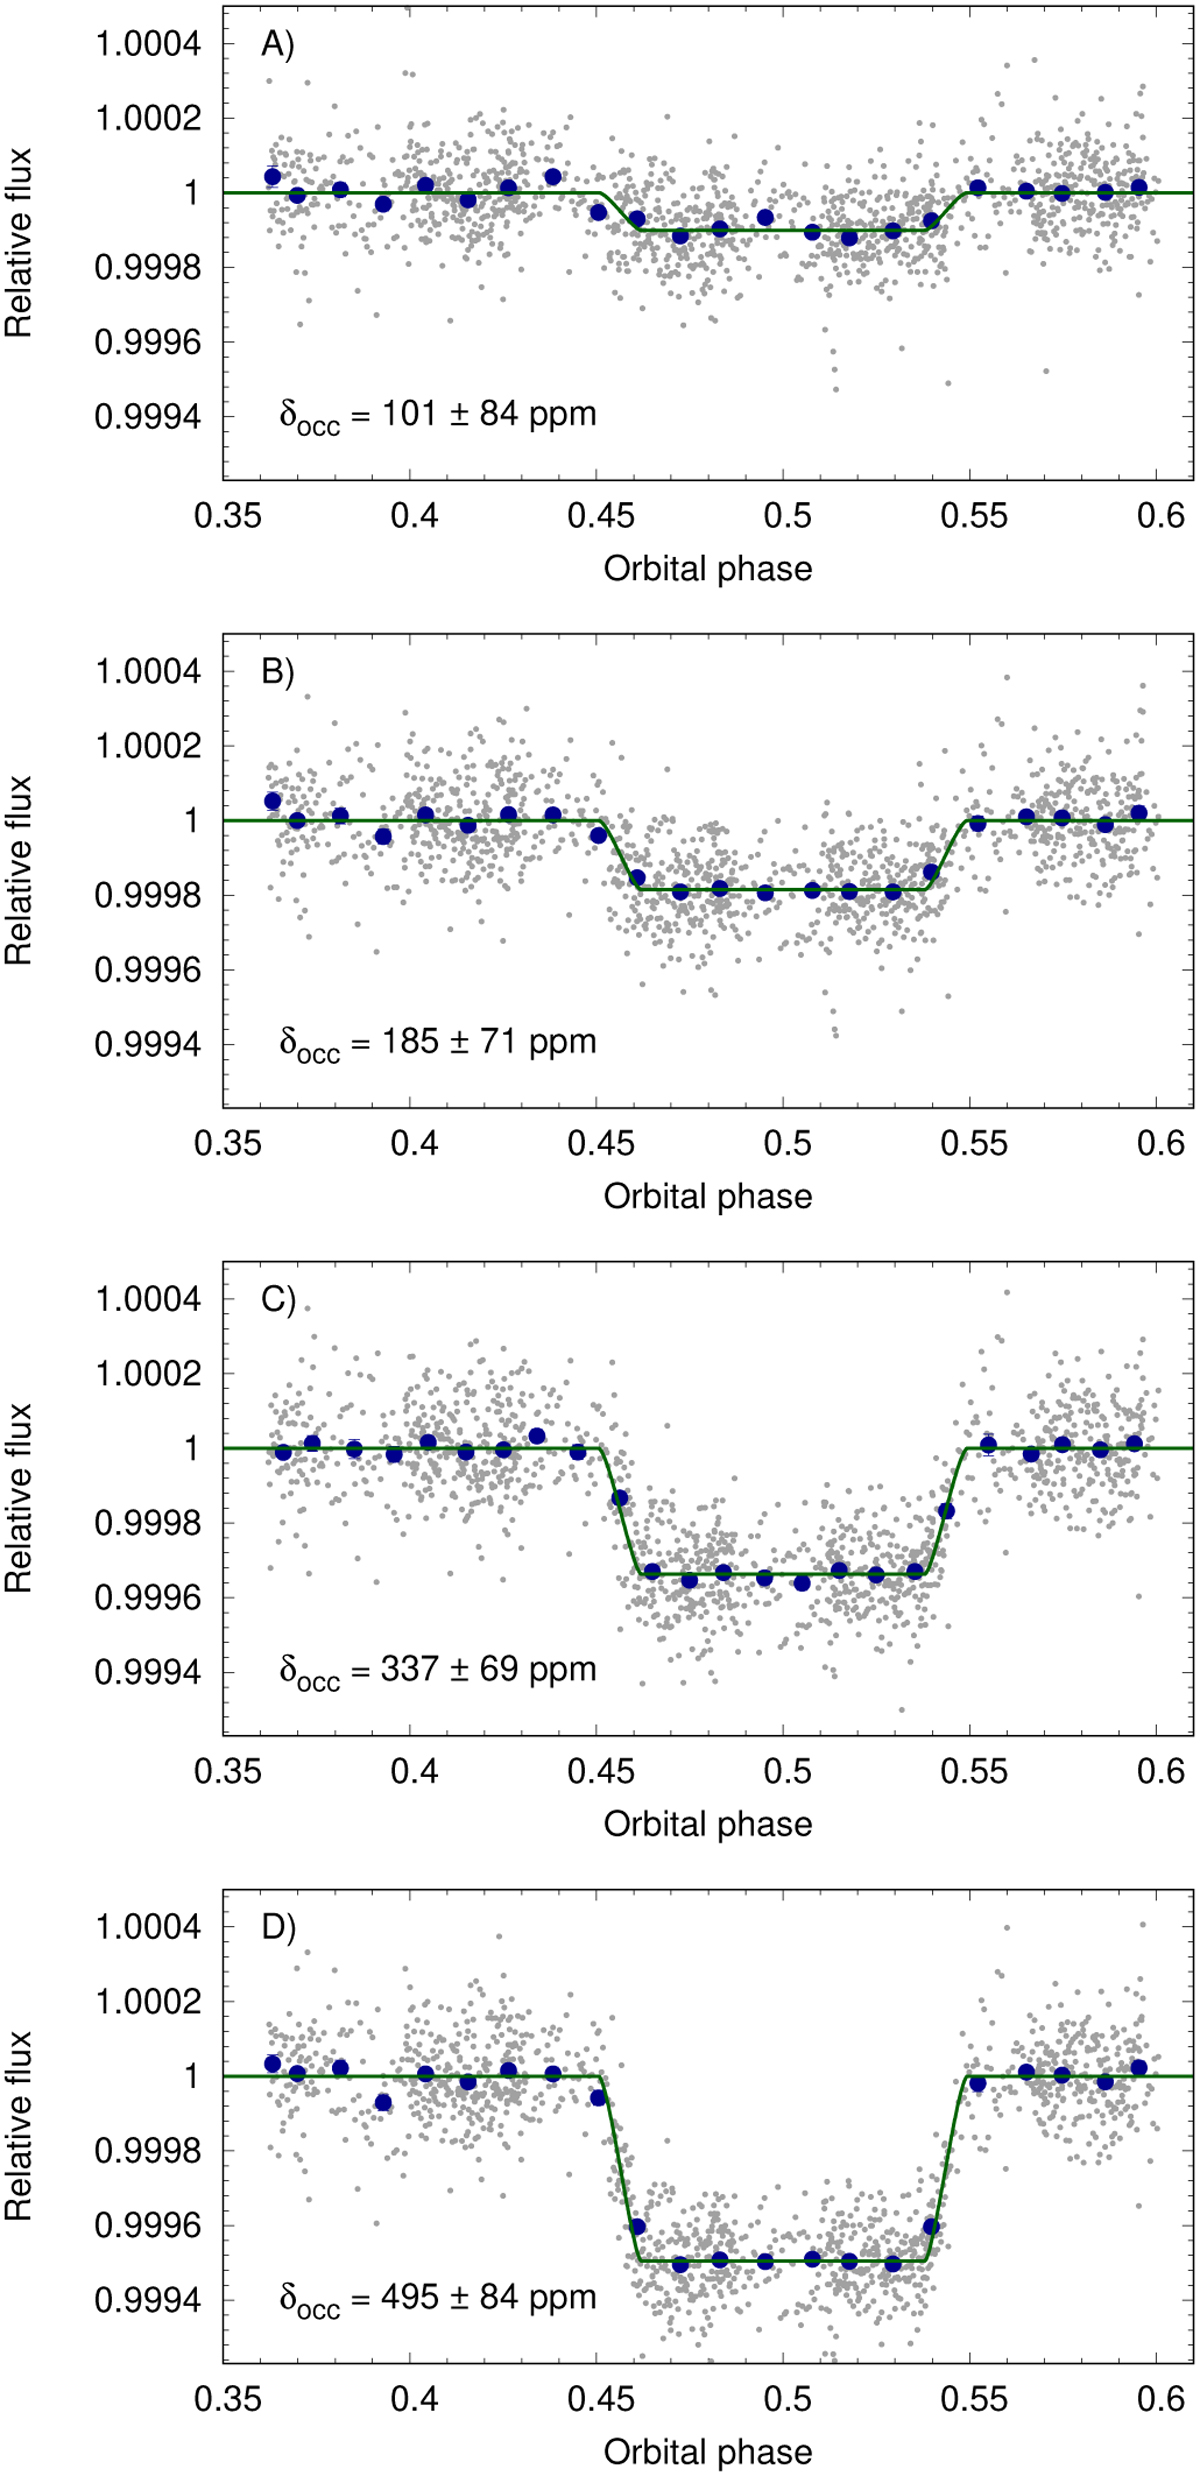
Examples of some of our fits to the CHEOPS occultation data, showing a range of occultation depths. In each panel, the grey points represent the unbinned data with the pulsation signal subtracted, the larger, dark blue points are binned to 0.01 in orbital phase (about 17.6 minutes), and the green line is our best-fitting model for this particular treatment of the pulsations. A) three frequencies (from (Kálmán et al. 2022)) per occultation. B) 10 frequencies (from (von Essen et al. 2020)) fitted in common to all four occultations. C) as (B), but for 20 frequencies. D) 15 frequencies from this work (Section 4.2).
Current usage metrics show cumulative count of Article Views (full-text article views including HTML views, PDF and ePub downloads, according to the available data) and Abstracts Views on Vision4Press platform.
Data correspond to usage on the plateform after 2015. The current usage metrics is available 48-96 hours after online publication and is updated daily on week days.
Initial download of the metrics may take a while.