Fig. 1
Download original image
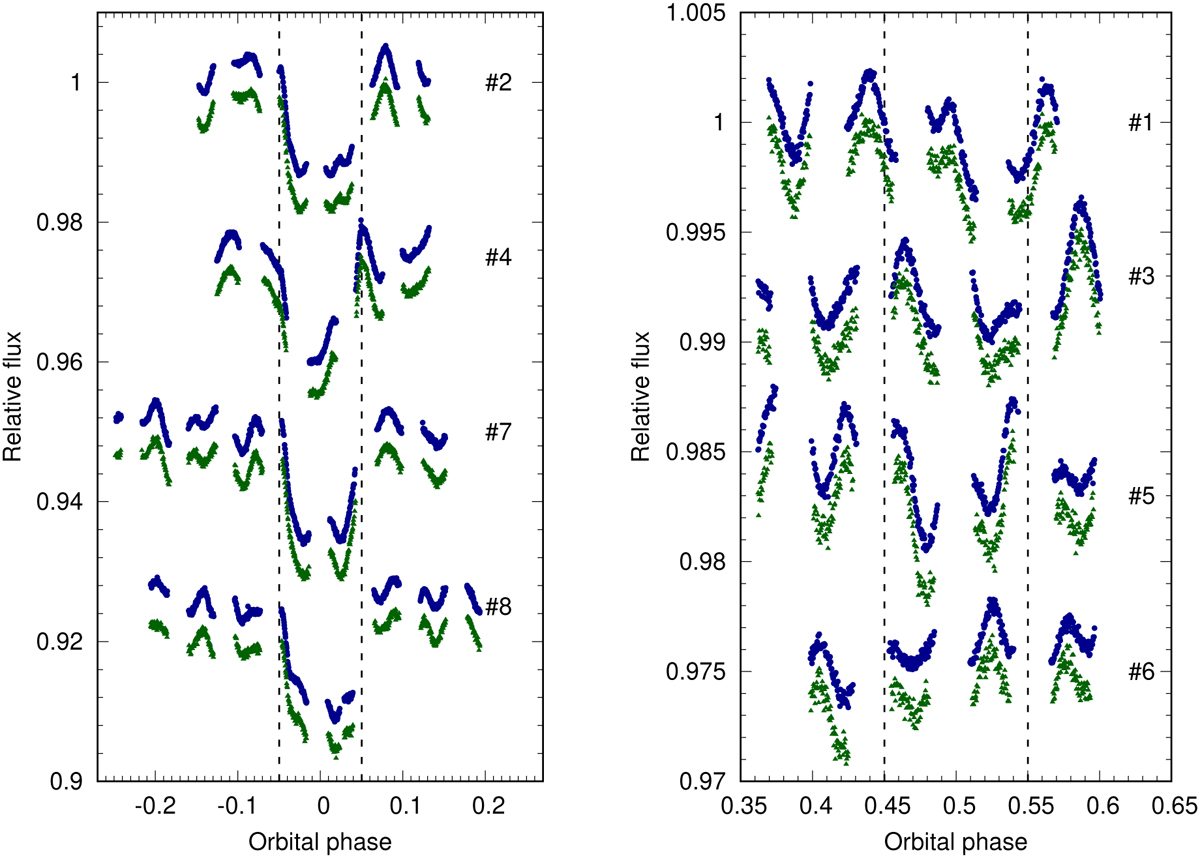
CHEOPS photometry of WASP-33 covering the transit (left) and occultation (right) of WASP-33 b. In each case, the PIPE light curve (blue circles) is shown with a small vertical offset with respect to the DRP light curve (green triangles). Larger offsets in flux are applied between each transit/occultation for clarity. Dashed vertical lines indicate the beginning and end of each eclipse. The number to the right of each light curve corresponds to the visit number given in Table 3.
Current usage metrics show cumulative count of Article Views (full-text article views including HTML views, PDF and ePub downloads, according to the available data) and Abstracts Views on Vision4Press platform.
Data correspond to usage on the plateform after 2015. The current usage metrics is available 48-96 hours after online publication and is updated daily on week days.
Initial download of the metrics may take a while.