Fig. 5
Download original image
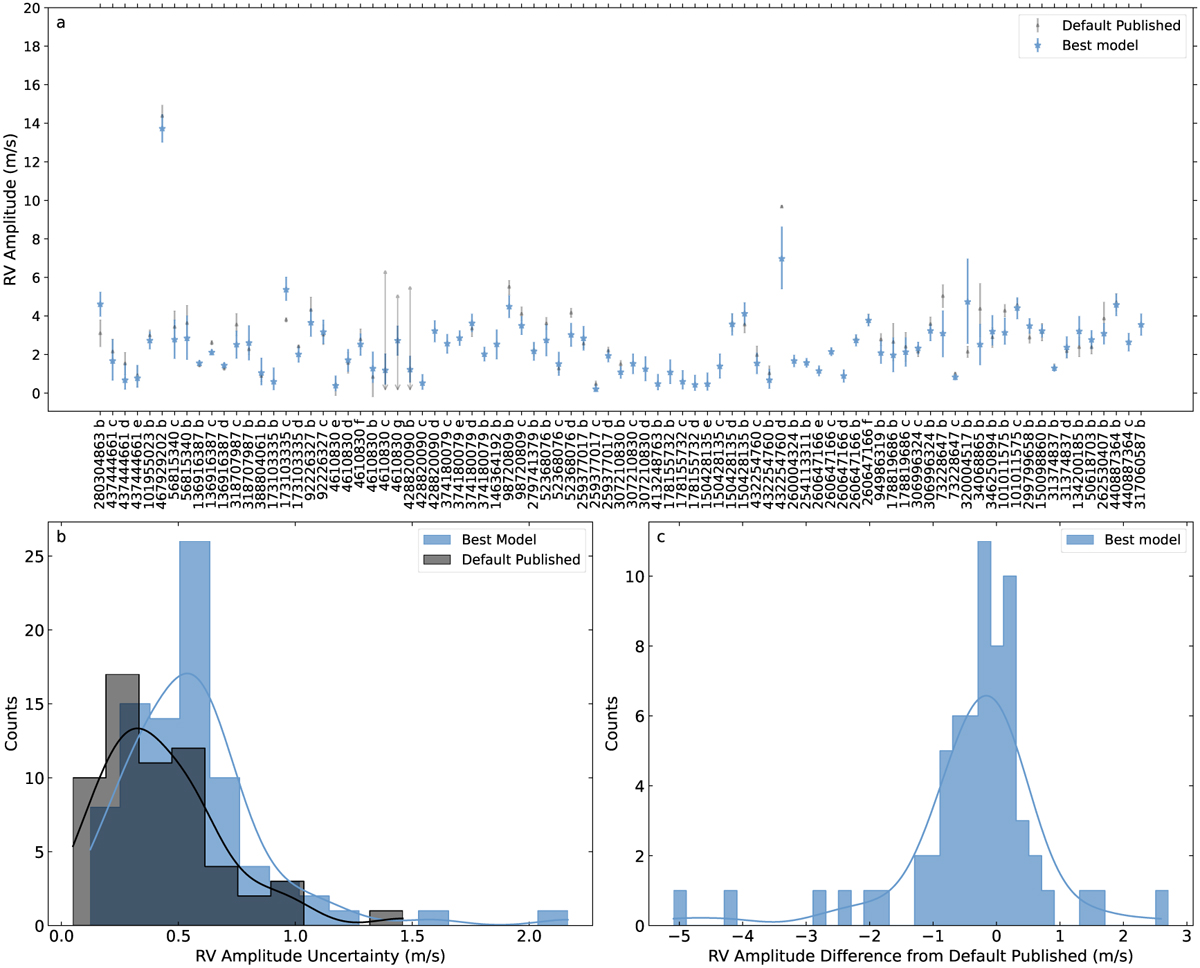
Panel a: RV amplitude found with the best model for each planet in our sample (blue stars) compared to the default published value from the NASA Exoplanet Archive (grey squares). Some planets do not have a published RV amplitude on the archive. Panel b: histogram showing the RV amplitude of our best model for each planet subtracted by the default published value. Panel c: histogram showing the RV amplitude uncertainty for our best model compared to the uncertainties of the default published amplitudes.
Current usage metrics show cumulative count of Article Views (full-text article views including HTML views, PDF and ePub downloads, according to the available data) and Abstracts Views on Vision4Press platform.
Data correspond to usage on the plateform after 2015. The current usage metrics is available 48-96 hours after online publication and is updated daily on week days.
Initial download of the metrics may take a while.