Fig. 2
Download original image
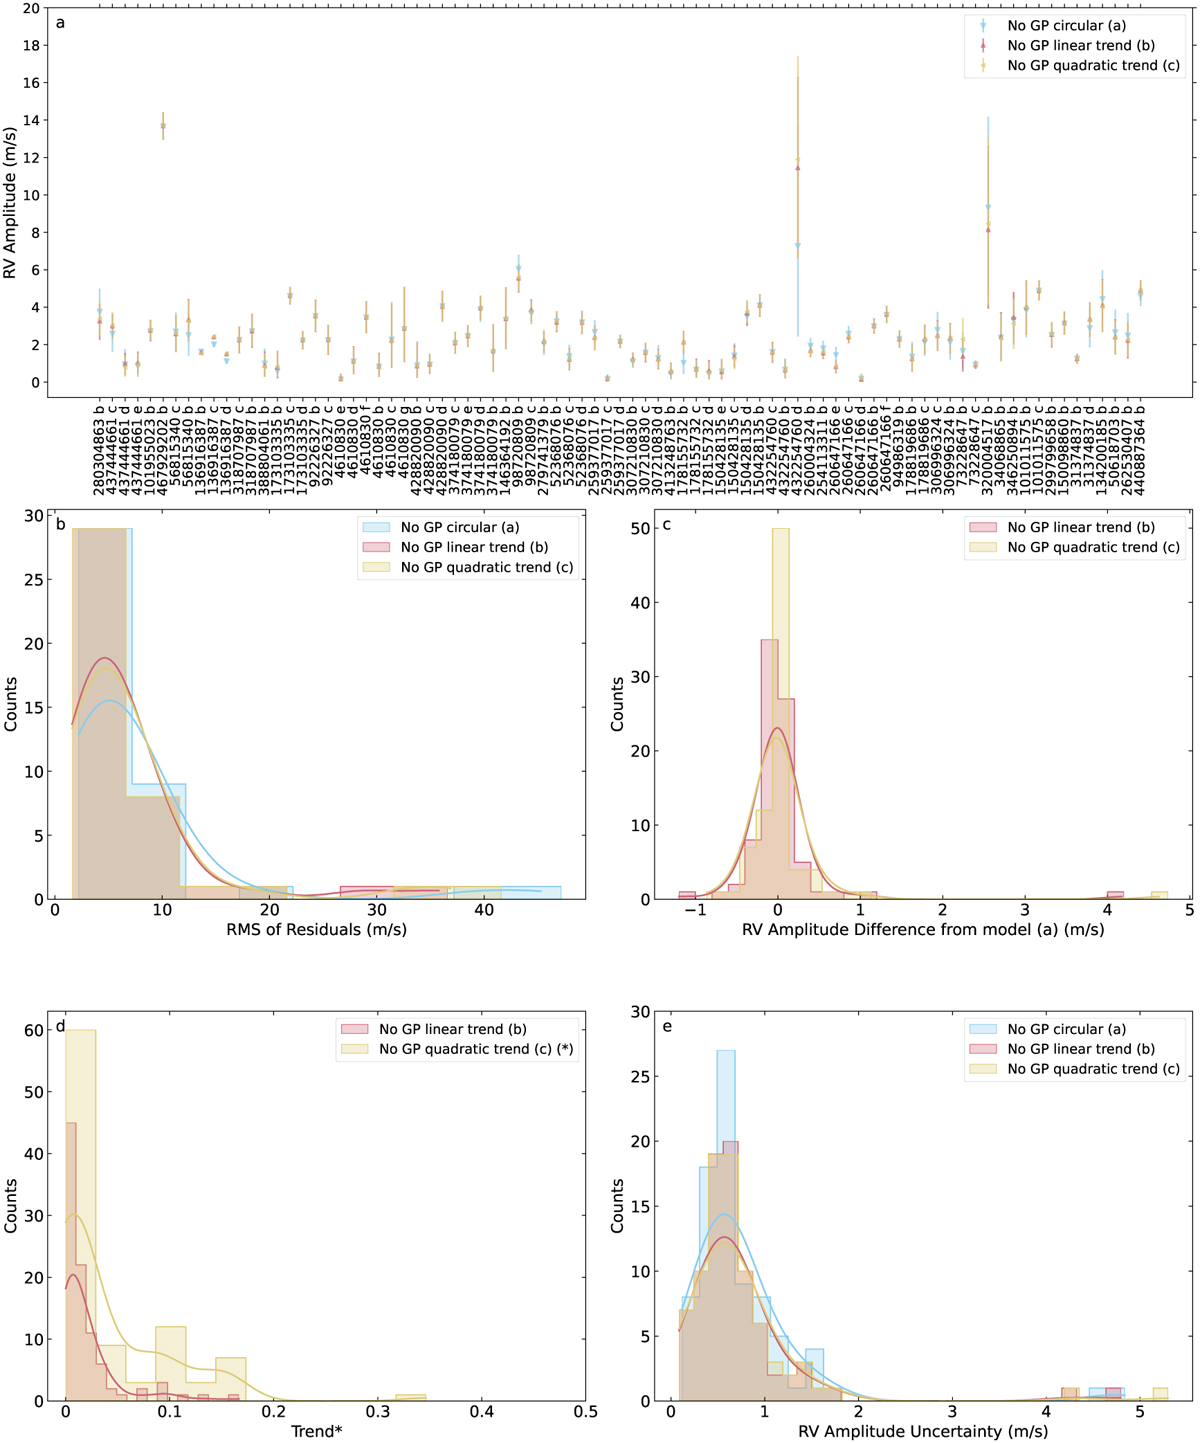
Impact of long-term trends. Panel a: comparison of the RV amplitude found for each target for three different models, a–c. Error bars show the 1σ uncertainty from the MCMC posteriors. Target names are given as TIC IDs with the letter of the planet. Panel b: histogram showing the root-mean-squared error of the residuals to the fit. Panel c: histogram showing the RV amplitude found compared to model a. Panel d: histogram showing the amplitude of the trend found (for the linear trend in m s−1 days−1, for the quadratic trend in m s−1 days−2). The asterisk marks cases where the value for the quadratic trend amplitude has been multiplied by 1000 to plot on the same axes. Panel e: histogram showing the 1σ uncertainty in the RV amplitude found for the different models.
Current usage metrics show cumulative count of Article Views (full-text article views including HTML views, PDF and ePub downloads, according to the available data) and Abstracts Views on Vision4Press platform.
Data correspond to usage on the plateform after 2015. The current usage metrics is available 48-96 hours after online publication and is updated daily on week days.
Initial download of the metrics may take a while.