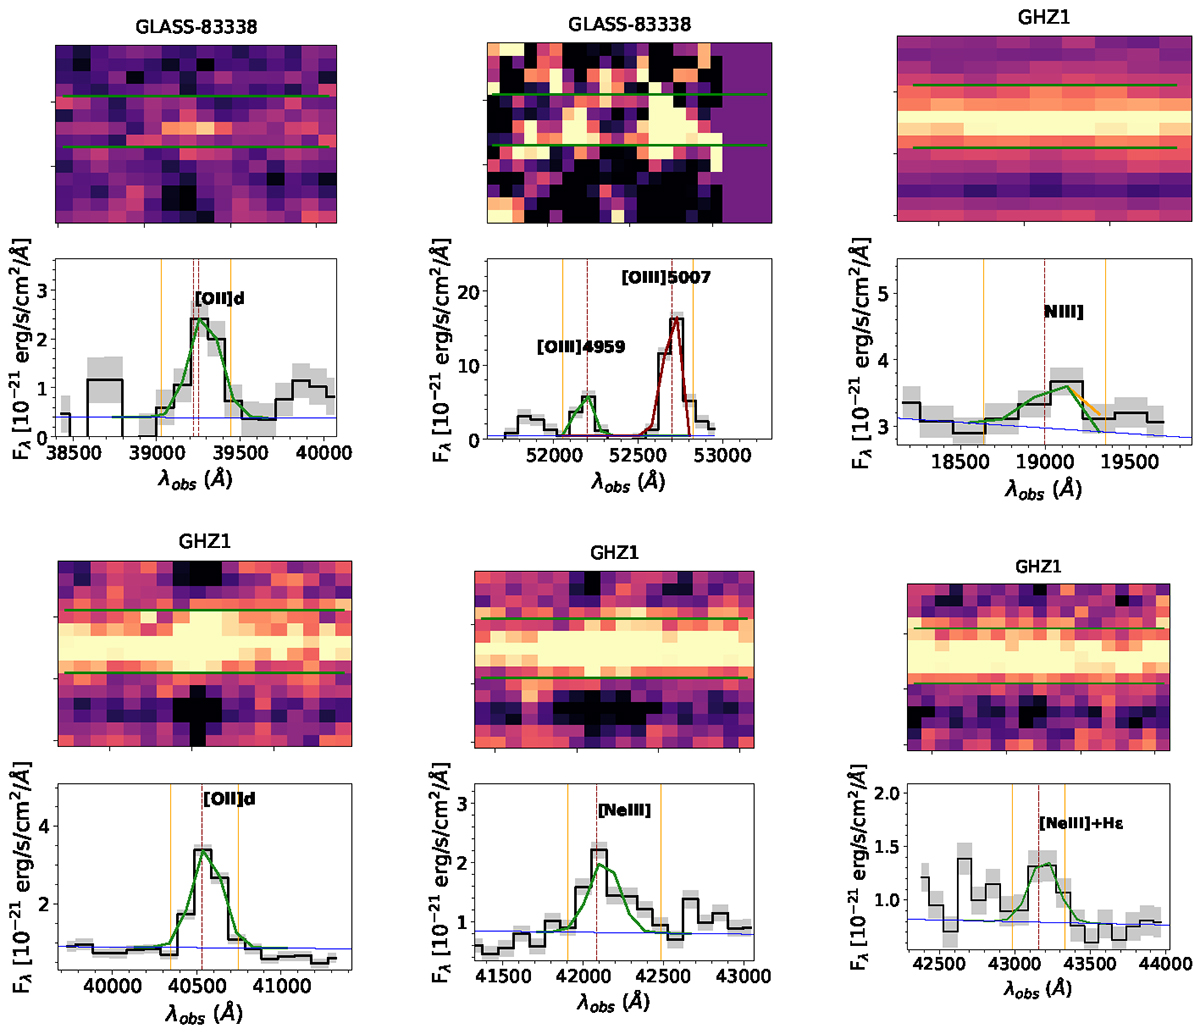
Fig. A.1.
Download original image
Best-fit Gaussian models for all the significant lines. The vertical orange lines highlight the spectral region where we evaluate the S/N of the features from direct integration. As in Fig. 2, horizontal green lines show the customized extraction apertures. Fluxes are corrected for the lensing magnification coefficients reported in Table 1.
Current usage metrics show cumulative count of Article Views (full-text article views including HTML views, PDF and ePub downloads, according to the available data) and Abstracts Views on Vision4Press platform.
Data correspond to usage on the plateform after 2015. The current usage metrics is available 48-96 hours after online publication and is updated daily on week days.
Initial download of the metrics may take a while.