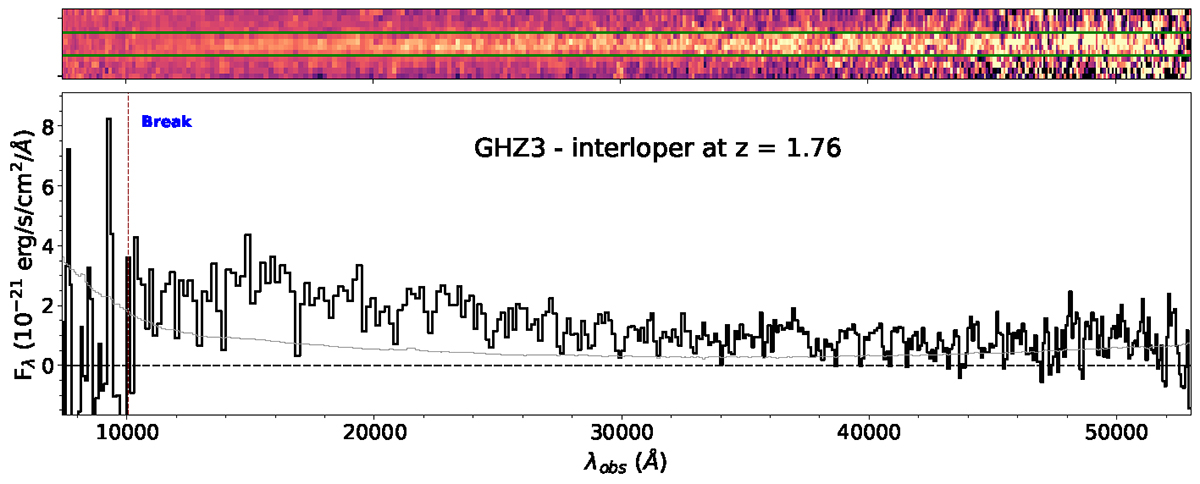
Fig. A.2.
Download original image
Observed 2D (upper panels) and 1D (lower panels) PRISM spectra of GHZ3. Symbols are the same as in Fig. 2. The Balmer (Lyman)-break feature is highlighted by the dashed vertical line, corresponding to z ∼ 1.76 (∼ 7.28). The lower redshift solution is compatible with the photometric redshift probability distribution P(z) discussed in Castellano et al. (2022).
Current usage metrics show cumulative count of Article Views (full-text article views including HTML views, PDF and ePub downloads, according to the available data) and Abstracts Views on Vision4Press platform.
Data correspond to usage on the plateform after 2015. The current usage metrics is available 48-96 hours after online publication and is updated daily on week days.
Initial download of the metrics may take a while.