Fig. 9.
Download original image
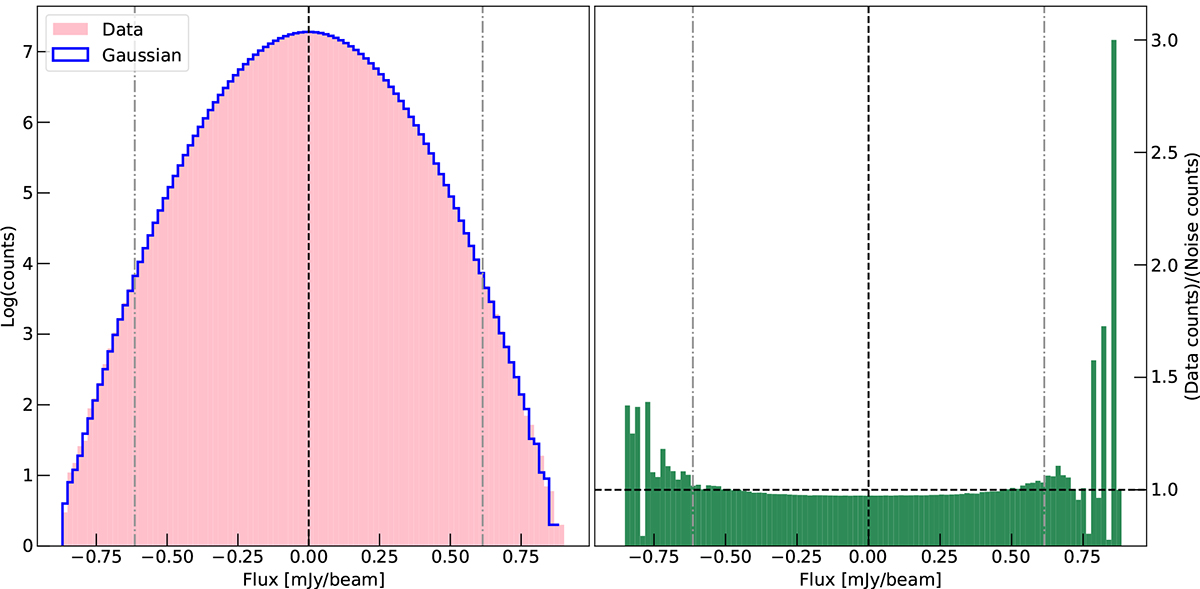
Comparison between the MeerKAT and Gaussian noise distribution. Left panel: the pink linear-log histogram represent the number of voxels with a given flux value in a MeerKAT cube, known to contain no bright galaxies. The blue linear-log histogram is instead computed from a Gaussian noise cube. The black dashed vertical line is the reference 0-flux level, whereas the two grey dash-dotted lines are denoting the ±4σ level. Right panel: ratio between the pink and blue histograms of the left panel. If the MeerKAT noise is truly Gaussian, the ratio should be ∼1 for every flux bin. The black dashed horizontal line marks the 1-to-1 ratio.
Current usage metrics show cumulative count of Article Views (full-text article views including HTML views, PDF and ePub downloads, according to the available data) and Abstracts Views on Vision4Press platform.
Data correspond to usage on the plateform after 2015. The current usage metrics is available 48-96 hours after online publication and is updated daily on week days.
Initial download of the metrics may take a while.