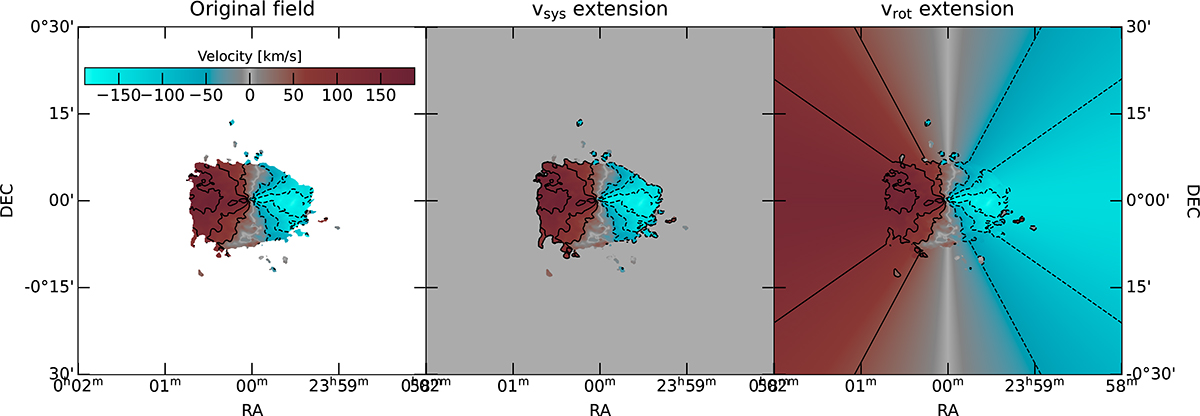
Fig. 5.
Download original image
Comparison between differently extended velocity fields. Left panel: SoFiA-2 moment 1 map of the TNG50 galaxy 520855. Black solid-contours denote receding (50, 100, 150) km s−1 velocities with respect to the systemic velocity. Black dashed-contours instead refer to approaching ( − 150, −100, −50) km s−1 velocities. Centre panel: Velocity field extended with the systemic velocity. Right panel: Velocity field extended with the rotation velocity of the HI disk.
Current usage metrics show cumulative count of Article Views (full-text article views including HTML views, PDF and ePub downloads, according to the available data) and Abstracts Views on Vision4Press platform.
Data correspond to usage on the plateform after 2015. The current usage metrics is available 48-96 hours after online publication and is updated daily on week days.
Initial download of the metrics may take a while.