Fig. 4.
Download original image
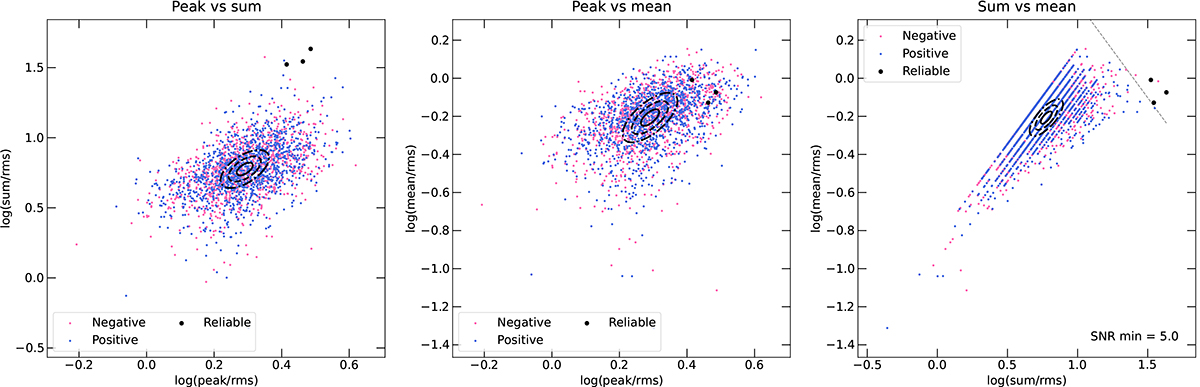
Reliability plot of the sources detected in the J1318-21 full-depth cube (intermediate cell size). Left panel: ![]() vs.
vs. ![]() projection of the (
projection of the (![]() ,
, ![]() and
and ![]() ) parameter space. Blue, pink and black points are the positive, negative and reliable sources, respectively, detected in the 225 stacked spectra computed for the J1318-21 full-depth cube when using the intermediate cell size. The solid, dashed and dash-dotted black ellipses represent, respectively, the two-dimensional 1, 2 and 3 times the standard deviation of the source distribution. Centre panel:
) parameter space. Blue, pink and black points are the positive, negative and reliable sources, respectively, detected in the 225 stacked spectra computed for the J1318-21 full-depth cube when using the intermediate cell size. The solid, dashed and dash-dotted black ellipses represent, respectively, the two-dimensional 1, 2 and 3 times the standard deviation of the source distribution. Centre panel: ![]() vs.
vs. ![]() projection. Right panel:
projection. Right panel: ![]() vs.
vs. ![]() projection. The dashed dark-grey line is the minimum S/N of a source in order to be considered reliable.
projection. The dashed dark-grey line is the minimum S/N of a source in order to be considered reliable.
Current usage metrics show cumulative count of Article Views (full-text article views including HTML views, PDF and ePub downloads, according to the available data) and Abstracts Views on Vision4Press platform.
Data correspond to usage on the plateform after 2015. The current usage metrics is available 48-96 hours after online publication and is updated daily on week days.
Initial download of the metrics may take a while.