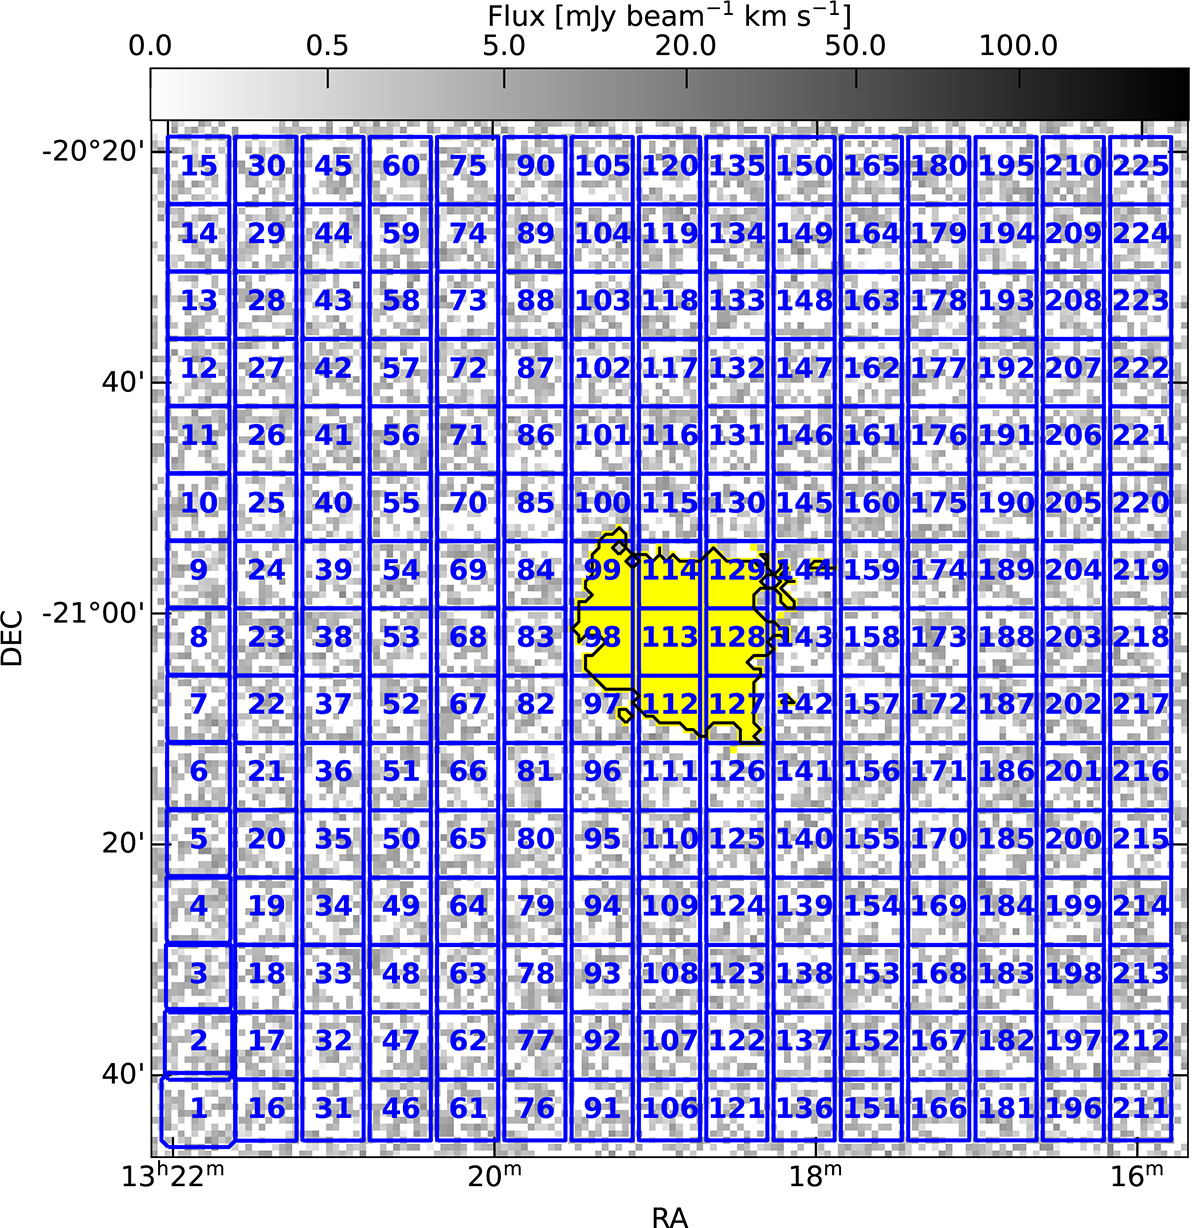
Fig. 3.
Download original image
Stacking regions for J1318-21 reported as blue squares. For the cell size displayed in the figure, STACKER will provide 225 stacked spectra, one for each region. The numbering helps for the bookkeeping. The background grey-scale image is the cube resulting from the preliminary manipulation steps (i.e. masking, shuffling and re-gridding) collapsed along the spectral axis and the black contours enclose the SoFiA-2 mask denote with a yellow colour.
Current usage metrics show cumulative count of Article Views (full-text article views including HTML views, PDF and ePub downloads, according to the available data) and Abstracts Views on Vision4Press platform.
Data correspond to usage on the plateform after 2015. The current usage metrics is available 48-96 hours after online publication and is updated daily on week days.
Initial download of the metrics may take a while.