Fig. 2.
Download original image
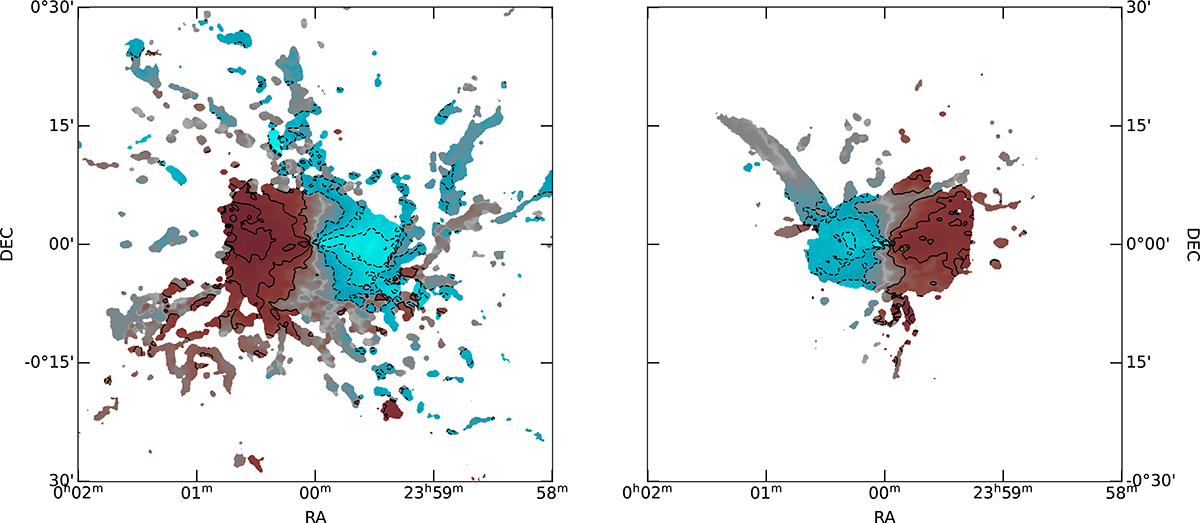
Moment 1 map of the two TNG50 galaxies presented in this paper: 520855 is on the left and 555013 is on the right. Black solid-contours denote the receding (50, 100, 150) km s−1 velocities with respect to the systemic velocity. Black dashed-contours instead refer to the approaching ( − 150, −100, −50) km s−1 velocities. The maps are clipped at the 1016 cm−2 column density level, as this is the noise level we expected to achieve via stacking.
Current usage metrics show cumulative count of Article Views (full-text article views including HTML views, PDF and ePub downloads, according to the available data) and Abstracts Views on Vision4Press platform.
Data correspond to usage on the plateform after 2015. The current usage metrics is available 48-96 hours after online publication and is updated daily on week days.
Initial download of the metrics may take a while.