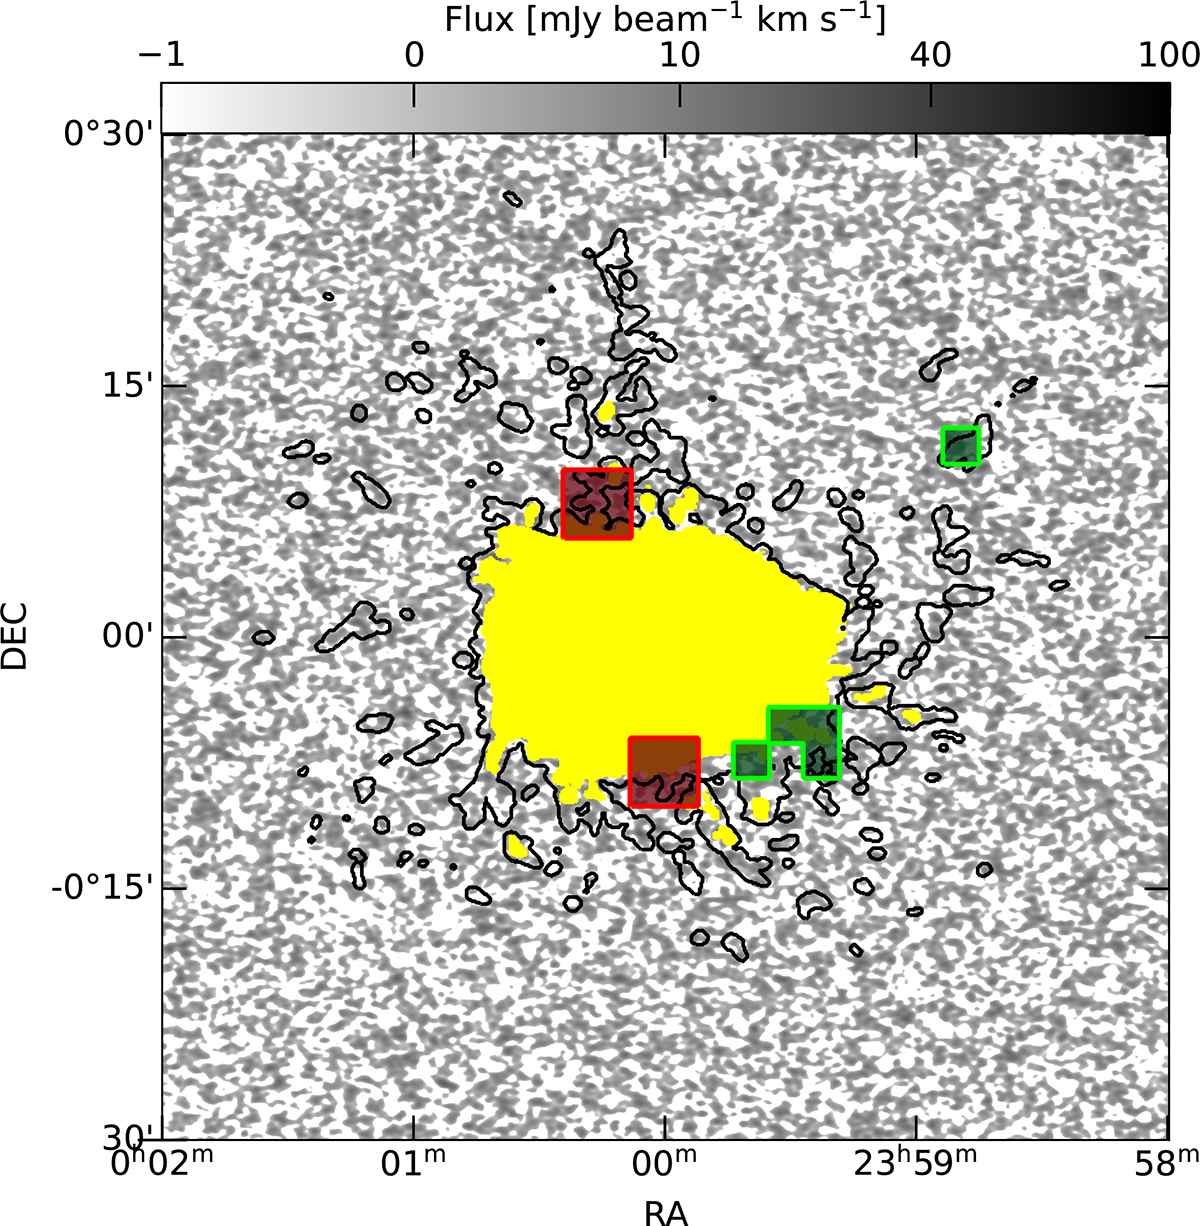
Fig. C.1.
Download original image
Stacking detection map without re-gridding the cube. The background grey-scale image is the cube of the TNG50 520855 galaxy collapsed along the spectral axis and blanked from the galaxy emission. Black contours denote the noiseless moment 0 map clipped at the column density value of 3.6 × 1017 cm−2. The coloured squares indicate the stacking regions where their stacked spectrum contains a reliable detection. Different colours represent different cell size: red for 9 × 9 and green for 5 × 5 beams.
Current usage metrics show cumulative count of Article Views (full-text article views including HTML views, PDF and ePub downloads, according to the available data) and Abstracts Views on Vision4Press platform.
Data correspond to usage on the plateform after 2015. The current usage metrics is available 48-96 hours after online publication and is updated daily on week days.
Initial download of the metrics may take a while.