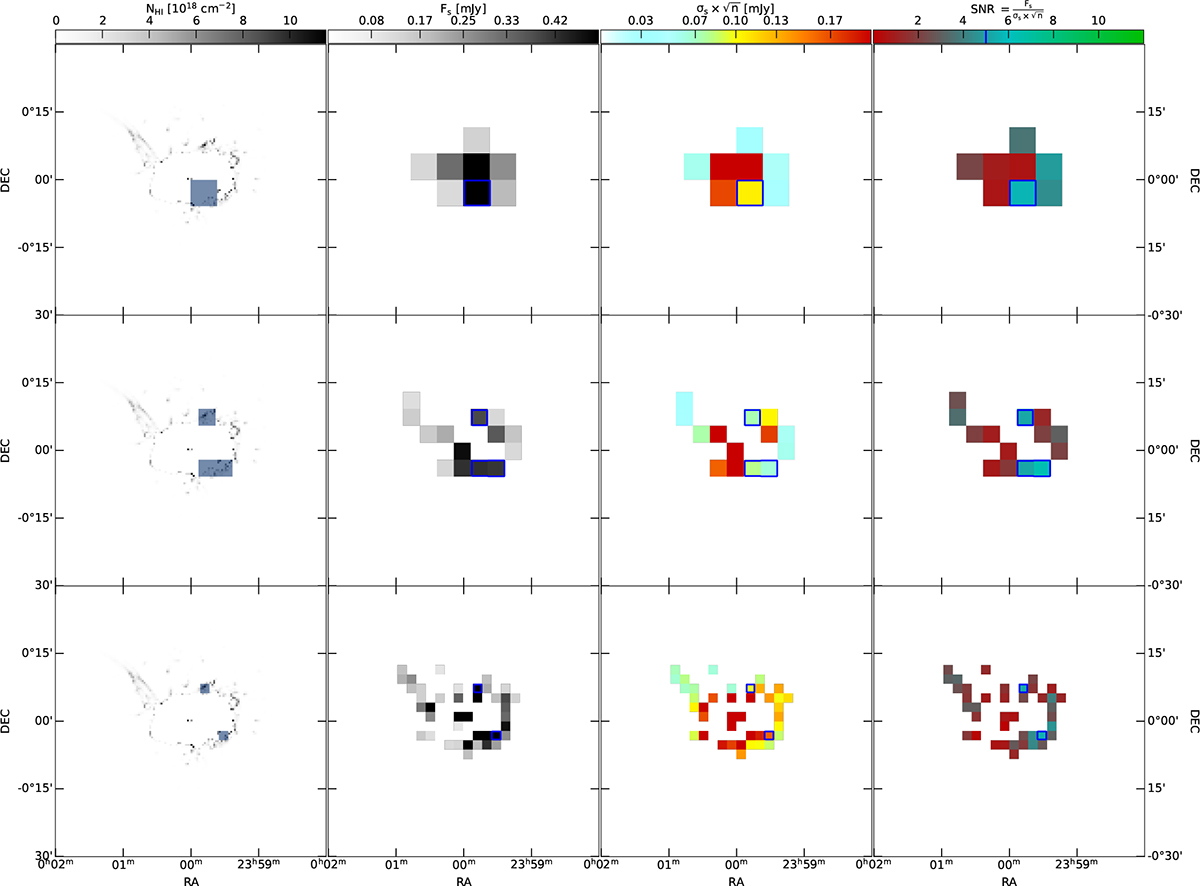
Fig. B.2.
Download original image
Stacking S/N maps for the TNG50 galaxy 55013. First column: stacking regions where S/N > 5 (blue squares) overlaid with the grey-scale noiseless moment 0 map, blanked from the emission already detected by SoFiA-2. Top to bottom is for cell sizes of 14 × 14, 9 × 9 and 5 × 5 beams, respectively. Second column: the integrated flux of the signal for stacking regions where the HI column density is > 3.6 × 1017 cm−2. The blue contours enclose the cells where S/N > 5. Third column: the noise of the stacked spectrum multiplied by the square root of the number of channels covered by the source. Fourth column: integrated S/N of the signal in the stacked spectrum for the regions. The S/N = 5 level is indicated also on the colourbar.
Current usage metrics show cumulative count of Article Views (full-text article views including HTML views, PDF and ePub downloads, according to the available data) and Abstracts Views on Vision4Press platform.
Data correspond to usage on the plateform after 2015. The current usage metrics is available 48-96 hours after online publication and is updated daily on week days.
Initial download of the metrics may take a while.