Fig. 11.
Download original image
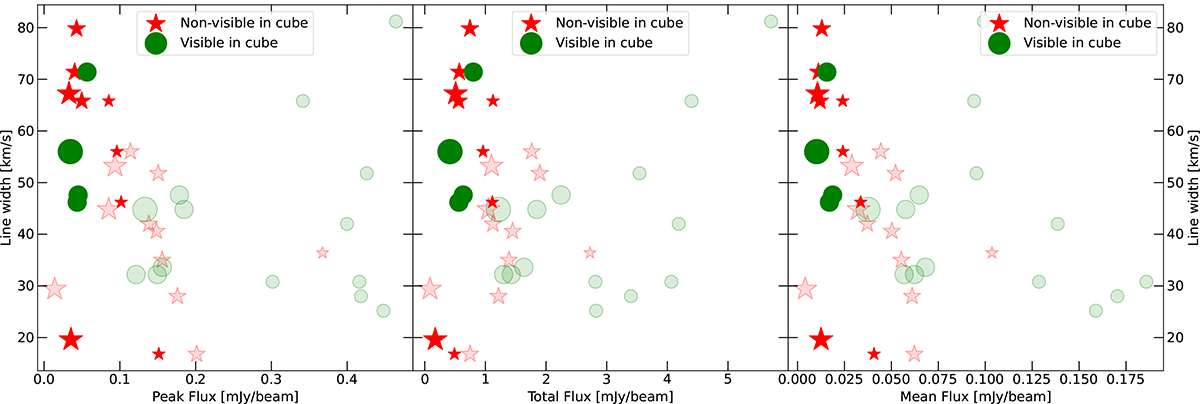
Peak flux (left panel), total flux (central panel), and mean flux (right panel) of the stacking detections as a function of their width. Detections in single-track stacked spectra are provided in the background, while detections in full-depth stacked spectra are given in the foreground. Detections with no counterpart visible in the cube are labelled with red stars. Green circles refer to visually identified HI emission. The size of the markers is indicative of the size of the square regions used for the stacking.
Current usage metrics show cumulative count of Article Views (full-text article views including HTML views, PDF and ePub downloads, according to the available data) and Abstracts Views on Vision4Press platform.
Data correspond to usage on the plateform after 2015. The current usage metrics is available 48-96 hours after online publication and is updated daily on week days.
Initial download of the metrics may take a while.