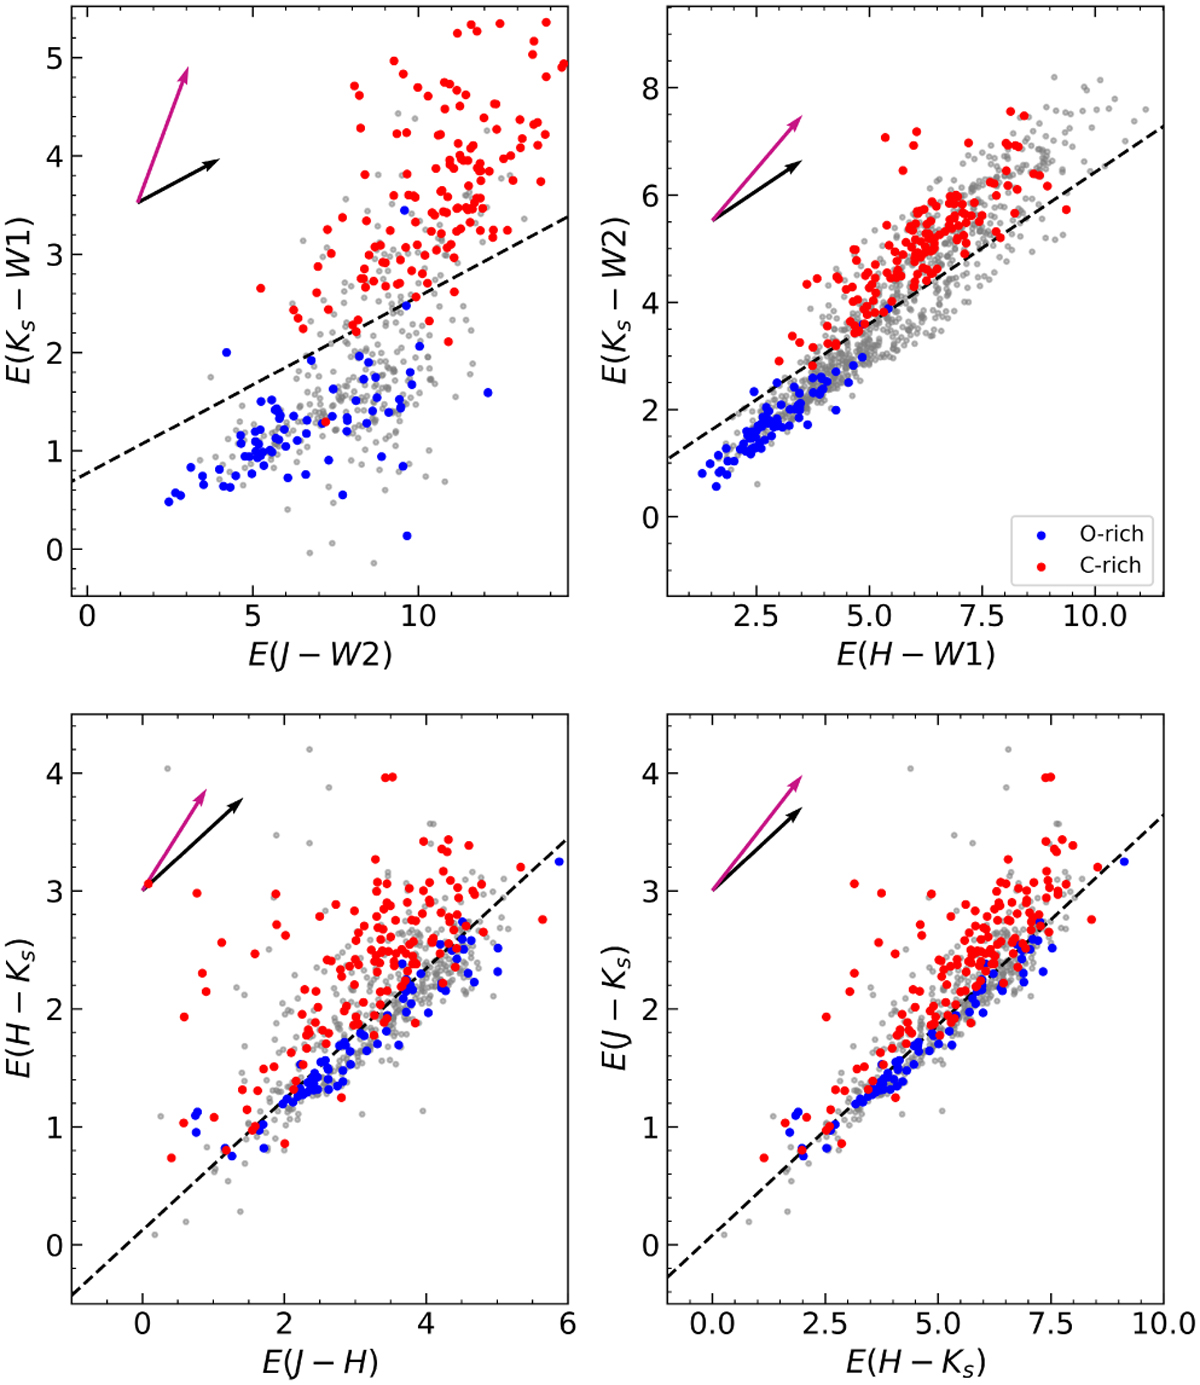
Fig. 9
Download original image
Distribution of C-rich and O-rich VarZoo Miras in excess color planes detailed in Table 1. Red points show C-rich Miras, Blue points indicate O-rich Miras, and gray points show the rest of the VarZoo sample. Black arrows indicate the extinction law from Wang & Chen (2019) in the top panels and this study in the bottom panels. Magenta arrows show the fit for C-rich Miras from Yuan et al. (2017) in the same color planes. Dotted black lines show the derived separations between C-rich and O-rich Miras.
Current usage metrics show cumulative count of Article Views (full-text article views including HTML views, PDF and ePub downloads, according to the available data) and Abstracts Views on Vision4Press platform.
Data correspond to usage on the plateform after 2015. The current usage metrics is available 48-96 hours after online publication and is updated daily on week days.
Initial download of the metrics may take a while.