Fig. 8
Download original image
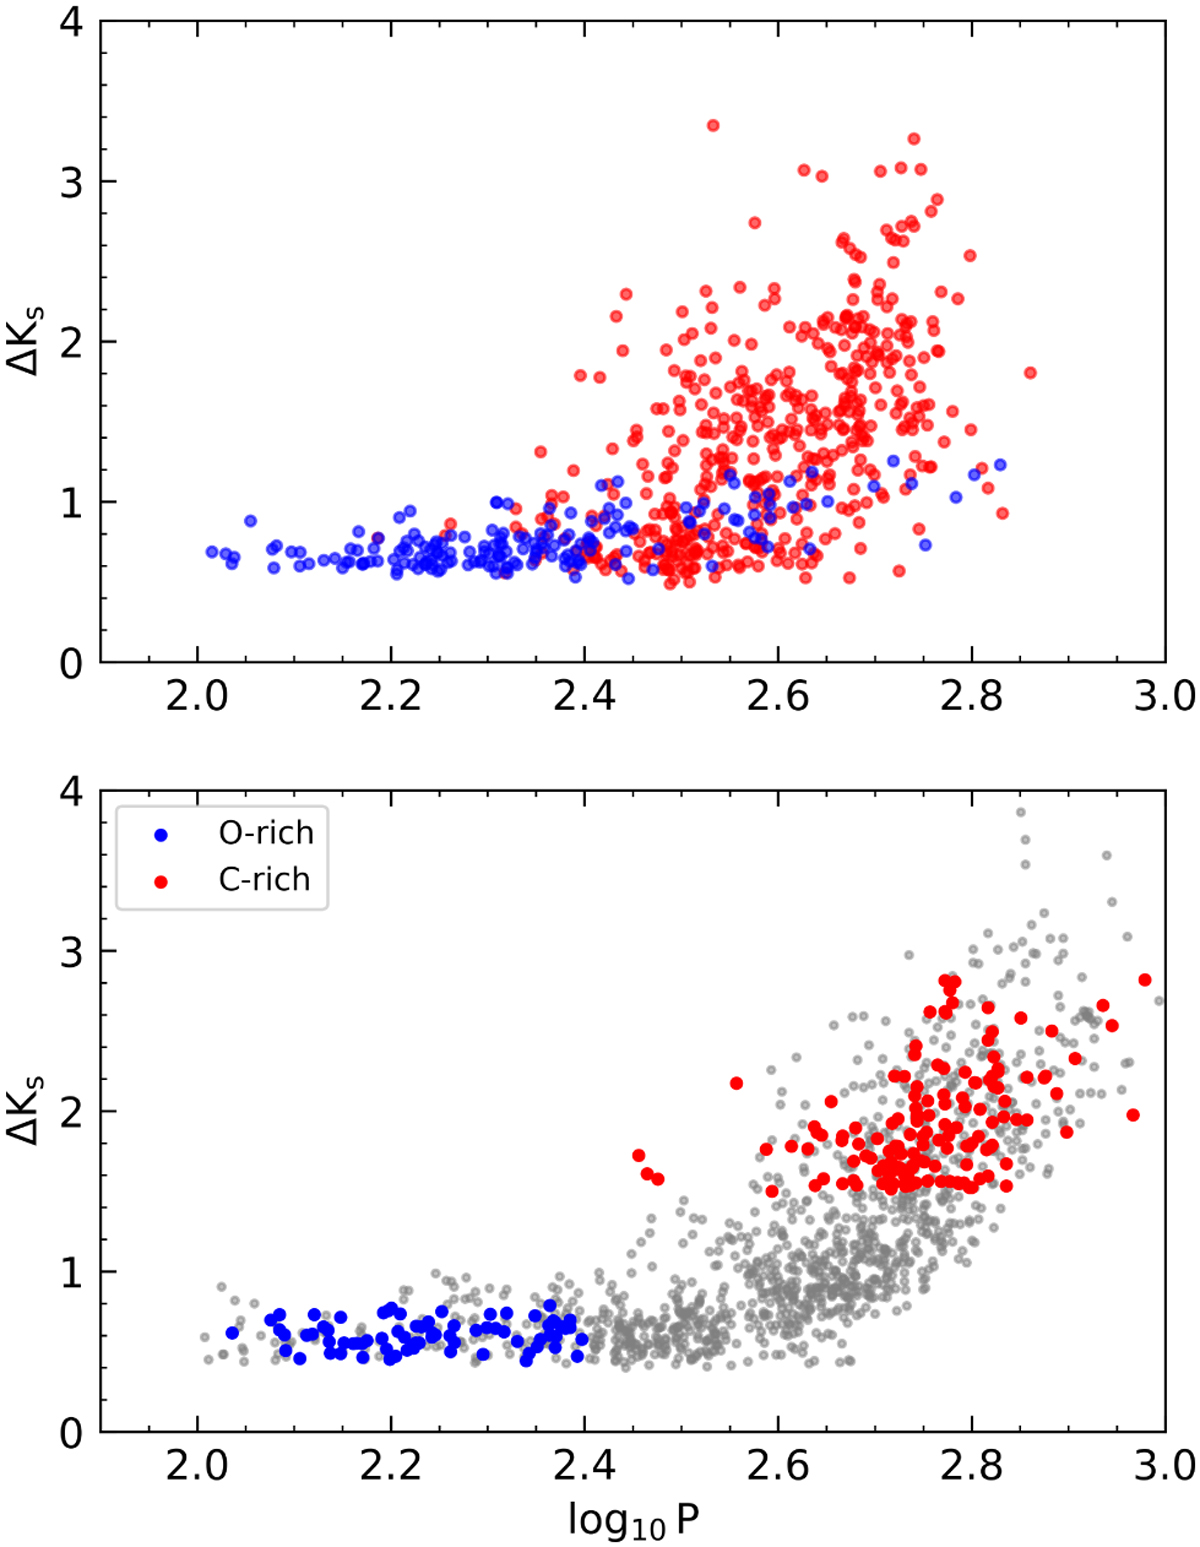
Period-amplitude distribution of VarZoo and LMC Miras. Red points indicate C-rich Miras, and blue points indicate O-rich Miras for both samples. Top: LMC Miras from Yuan et al. (2017) classified using Weseinheit indexes. Bottom: Miras from the VarZoo sample with the assigned classifications based on period and amplitude ranges.
Current usage metrics show cumulative count of Article Views (full-text article views including HTML views, PDF and ePub downloads, according to the available data) and Abstracts Views on Vision4Press platform.
Data correspond to usage on the plateform after 2015. The current usage metrics is available 48-96 hours after online publication and is updated daily on week days.
Initial download of the metrics may take a while.