Fig. 7
Download original image
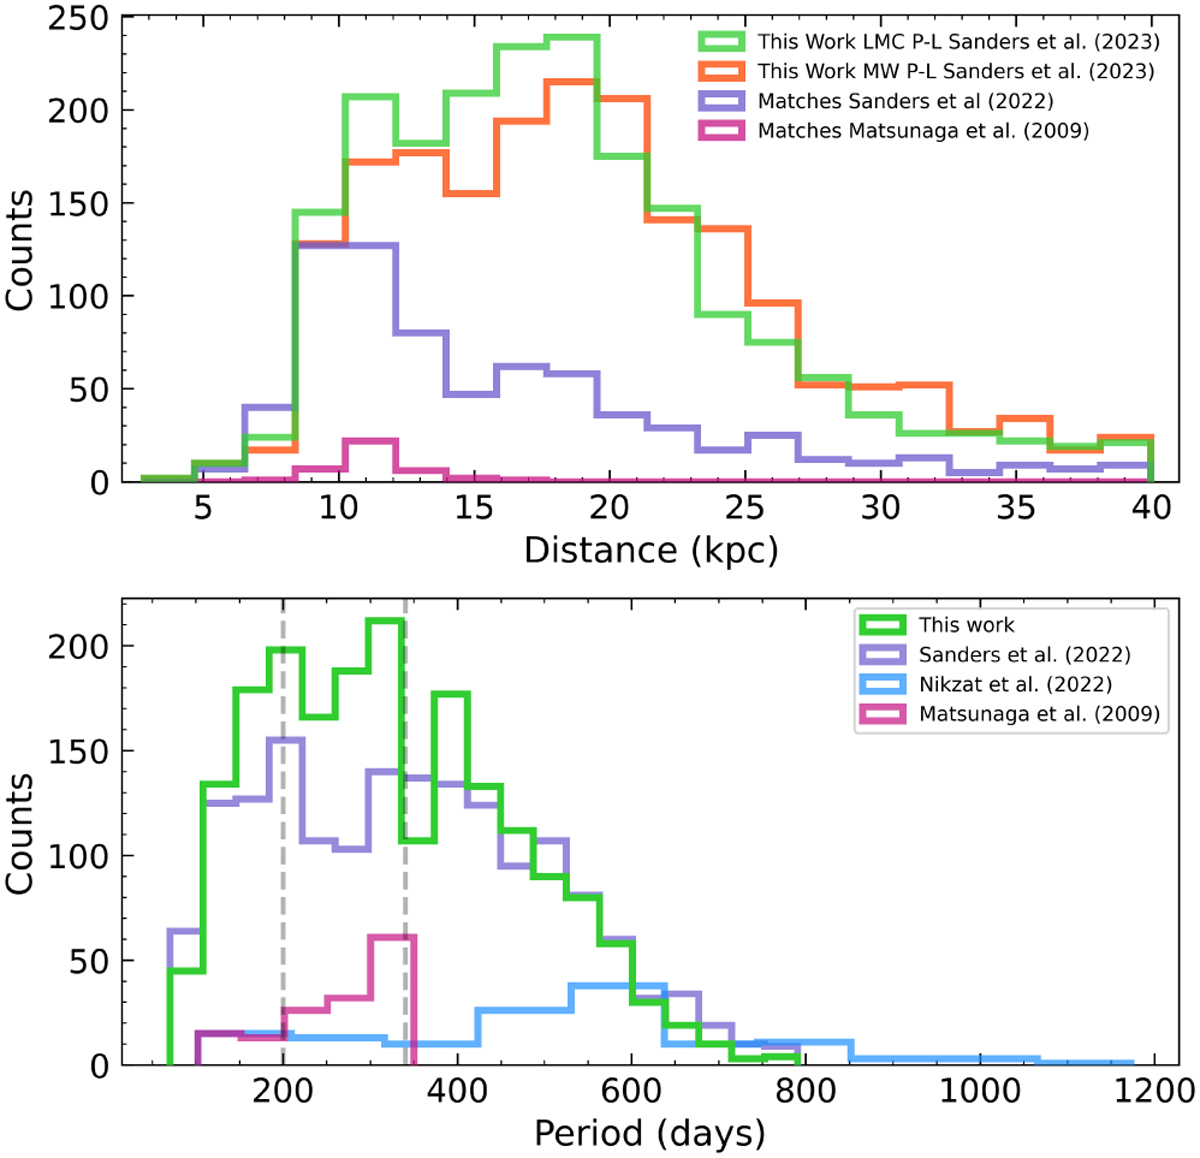
Comparison of different P-L relations and catalogs. Top: distance distribution of our sample using the P-L relations from Sanders (2023) using MW Miras (orange) and LMC Miras (green). We also show the distance distribution of matching Miras from Matsunaga et al. (2009, pink) and S22 (purple), also using the P-L relation using LMC Miras from Sanders (2023) adopted in this study. Bottom: period distribution of different catalogs. We show our final sample (green), the S22 catalog (purple), Matsunaga et al. (2009) catalog (pink), and the OGLE/VVV Mira catalog from Nikzat et al. (2022). We added two tentative peaks for the period distribution as vertical gray lines.
Current usage metrics show cumulative count of Article Views (full-text article views including HTML views, PDF and ePub downloads, according to the available data) and Abstracts Views on Vision4Press platform.
Data correspond to usage on the plateform after 2015. The current usage metrics is available 48-96 hours after online publication and is updated daily on week days.
Initial download of the metrics may take a while.