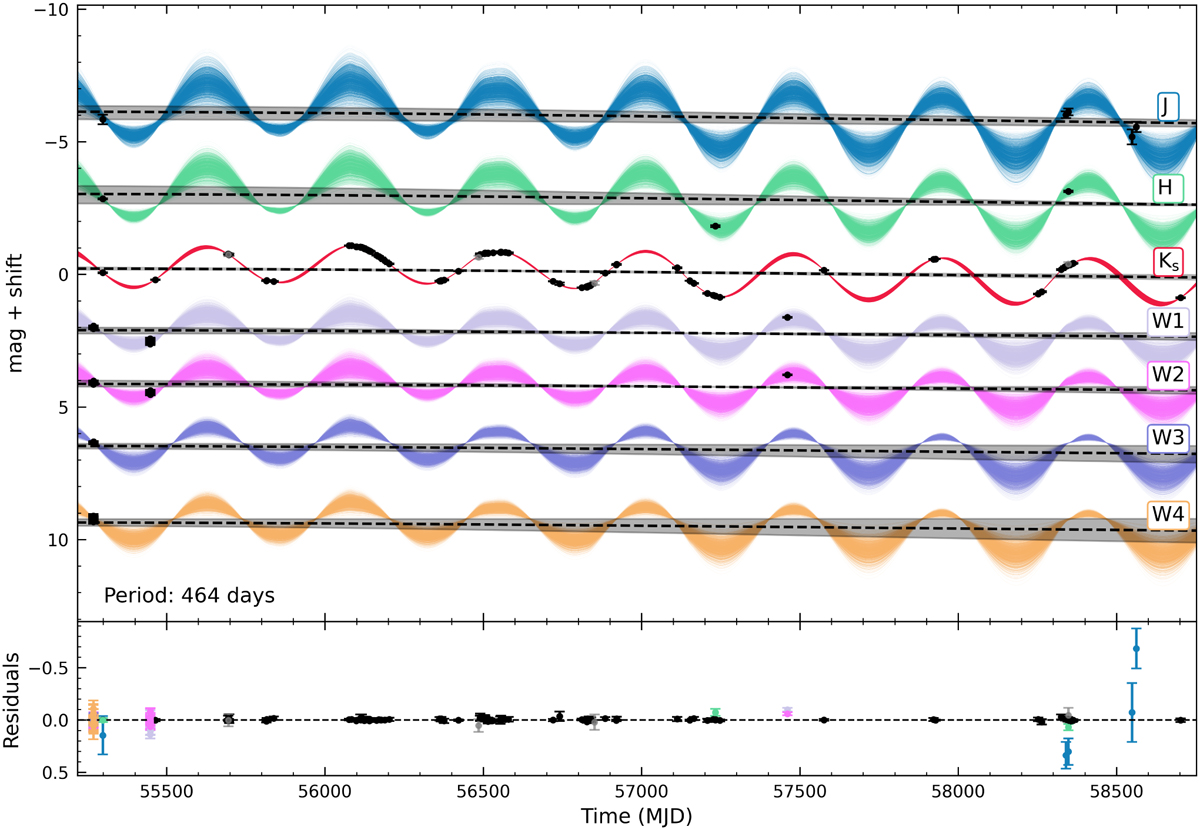
Fig. 4
Download original image
Example multiband light curve for a source in our catalog. Top: fitted models for a candidate in the different bands, ordered in increasing wavelength from top to bottom: J, H, Ks, W1, W2, W3, W4. Black points are photometric measurements in each band. Solid lines indicate each of the sampled models. Dashed gray lines are the modeled median trends with the respective confidence intervals in black-shaded regions. Bottom: residuals of the band modeling. Points are color-coded according to the observing band, as in the top panel.
Current usage metrics show cumulative count of Article Views (full-text article views including HTML views, PDF and ePub downloads, according to the available data) and Abstracts Views on Vision4Press platform.
Data correspond to usage on the plateform after 2015. The current usage metrics is available 48-96 hours after online publication and is updated daily on week days.
Initial download of the metrics may take a while.