Fig. 3
Download original image
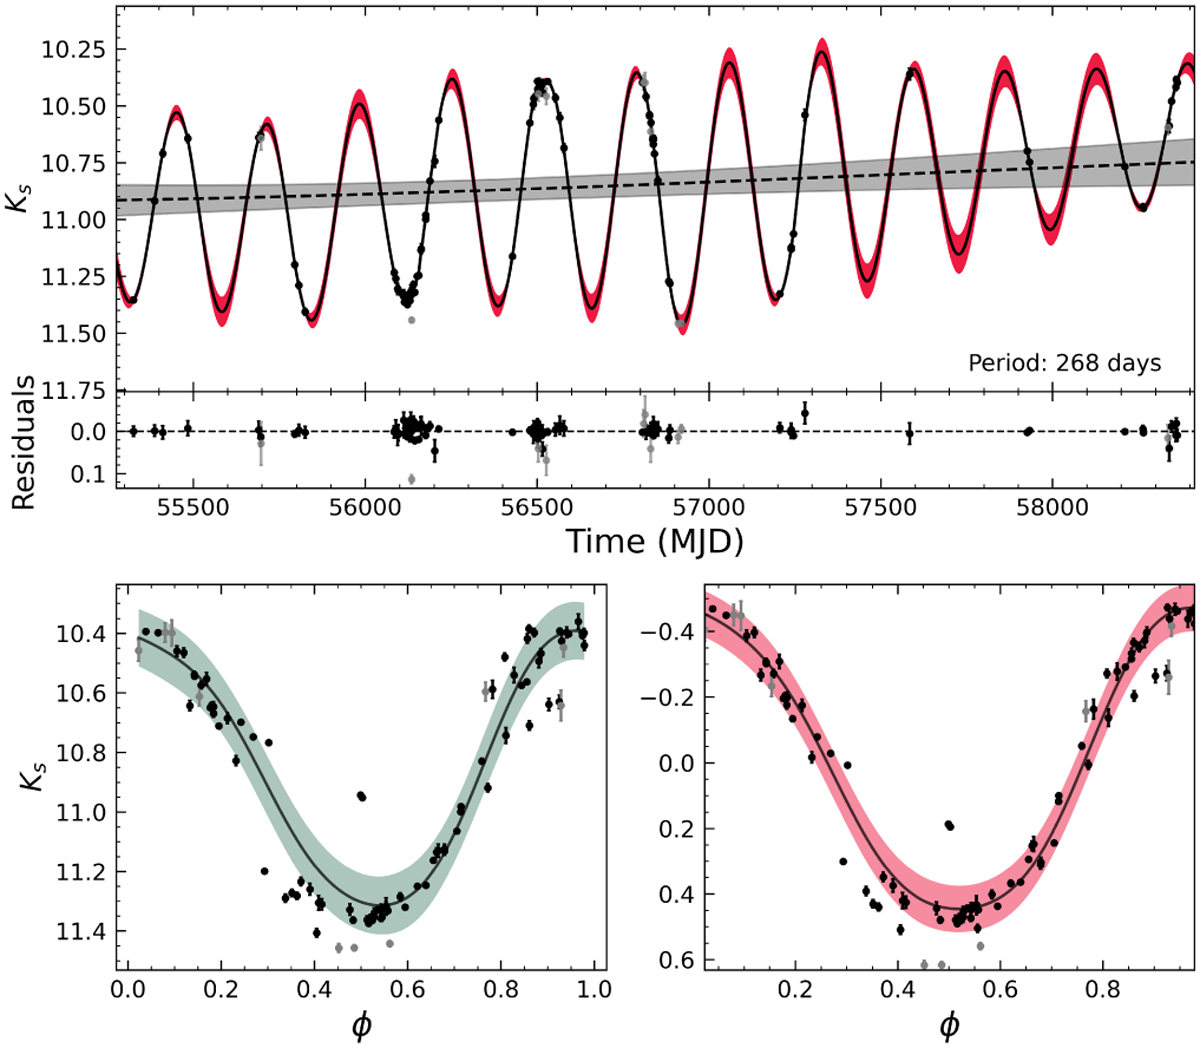
Example of the GP modeling for a single source. Top: time series photometry for this star; red shades denote the confidence intervals for the GP model, shaded black line denotes the median trend with corresponding confidence interval in gray. Gray and black points are masked and accepted points, respectively. Bottom panels: phased light curves for the star without (left) and with (right) the median trend correction applied. Colored regions are the confidence intervals for the Fourier fit.
Current usage metrics show cumulative count of Article Views (full-text article views including HTML views, PDF and ePub downloads, according to the available data) and Abstracts Views on Vision4Press platform.
Data correspond to usage on the plateform after 2015. The current usage metrics is available 48-96 hours after online publication and is updated daily on week days.
Initial download of the metrics may take a while.