Fig. 2
Download original image
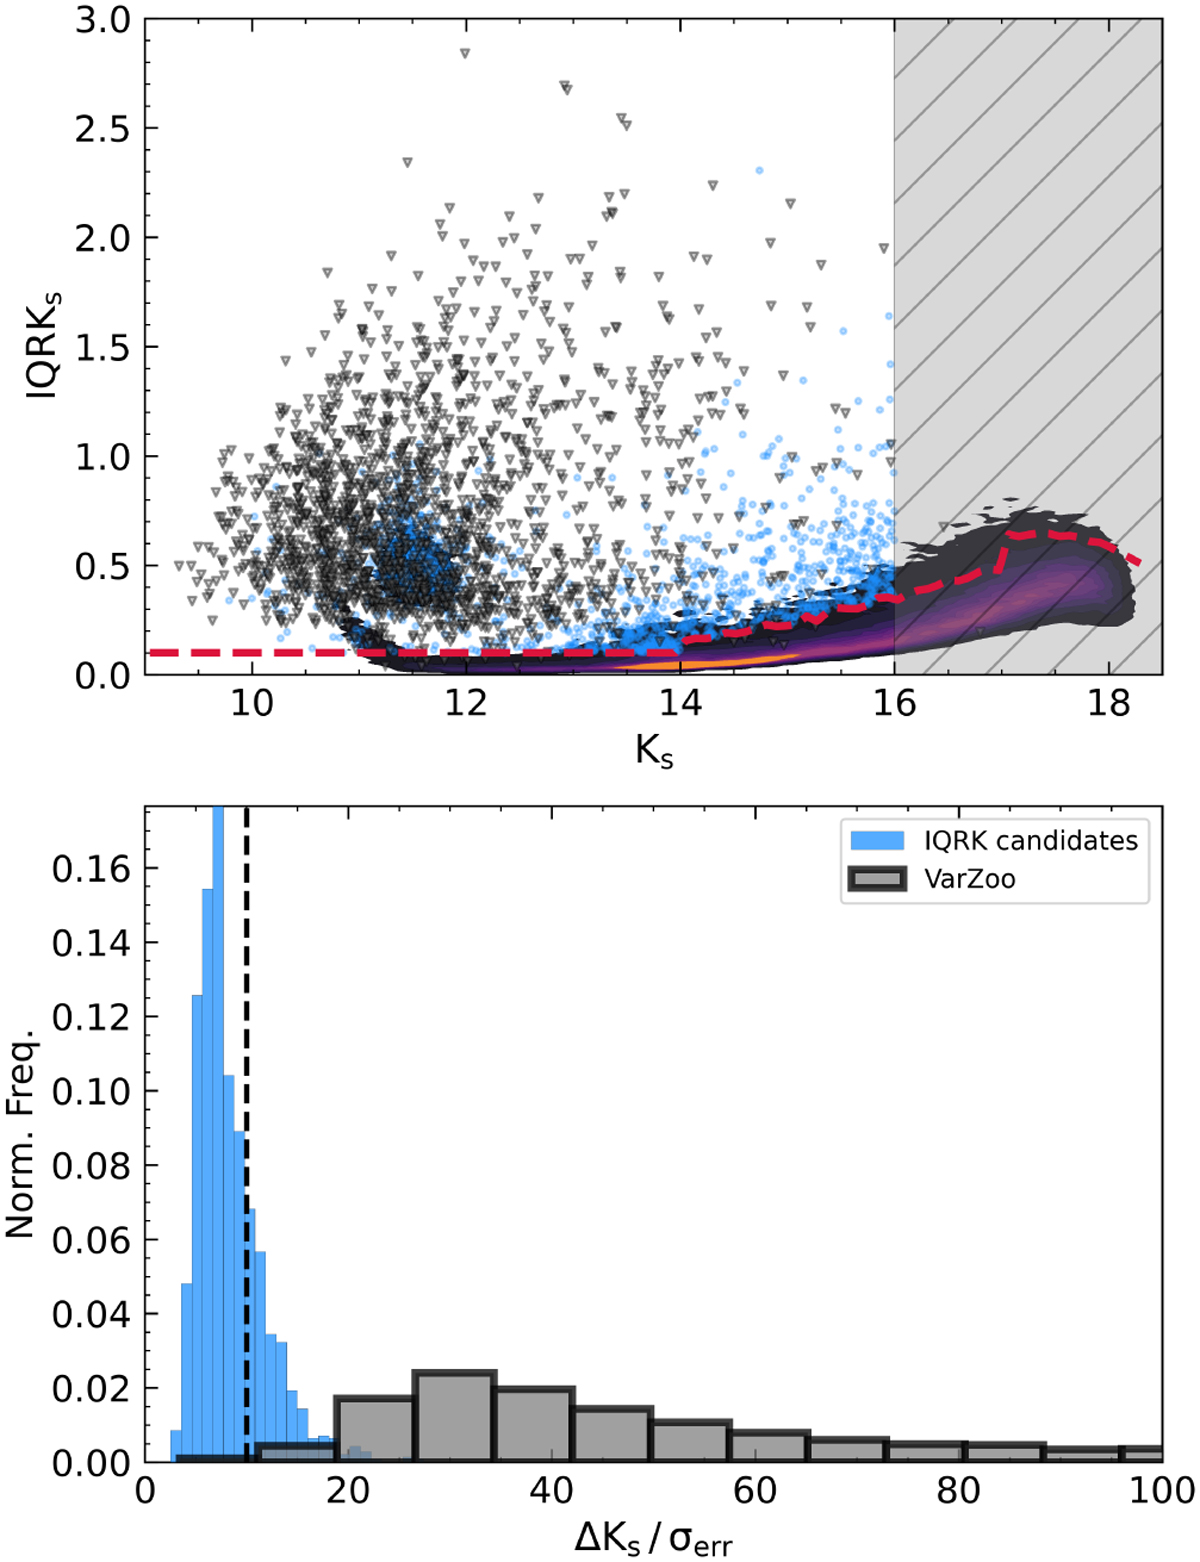
Amplitude-based cuts in Inter Quartile Range in Ks band and Amplitude over error for an example VVVx tile. Top: blue points show candidates that meet IQRKs and amplitude over noise criteria. The dashed red line shows the IQRKs threshold as a function of Ks magnitude; black triangles are the control VarZoo sample. Points inside the gray-shaded region are excluded from further analysis. Bottom: histogram of the amplitude of variability over the sourceaveraged photometric error. Blue histograms are sources that passed the IQRKs cuts, and the gray histogram is the VarZoo sample. The dotted black line defines the threshold value to further consider candidates (ΔKs/σ ≥ 10).
Current usage metrics show cumulative count of Article Views (full-text article views including HTML views, PDF and ePub downloads, according to the available data) and Abstracts Views on Vision4Press platform.
Data correspond to usage on the plateform after 2015. The current usage metrics is available 48-96 hours after online publication and is updated daily on week days.
Initial download of the metrics may take a while.