Fig. 17
Download original image
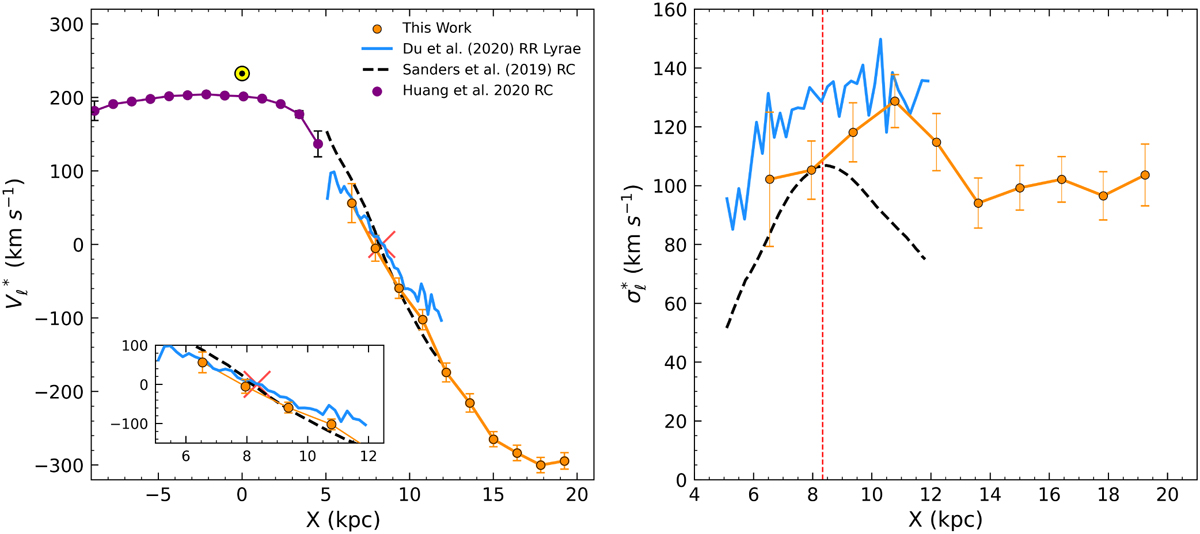
Rotation curve of the Galaxy seen by our Mira sample. Left: Galactocentric Transversal velocity Right: velocity dispersion of the Mira sample. We add the corresponding curves from Sanders et al. (2019) (black) and Du et al. (2020) (blue). We include the rotation curve derived from RC stars from Huang et al. (2020) (purple). The velocity and position of the Sun are showcased in yellow. The red cross and the dashed line indicate the position of the Galactic center at a value of ![]() .
.
Current usage metrics show cumulative count of Article Views (full-text article views including HTML views, PDF and ePub downloads, according to the available data) and Abstracts Views on Vision4Press platform.
Data correspond to usage on the plateform after 2015. The current usage metrics is available 48-96 hours after online publication and is updated daily on week days.
Initial download of the metrics may take a while.