Open Access
Fig. 15
Download original image
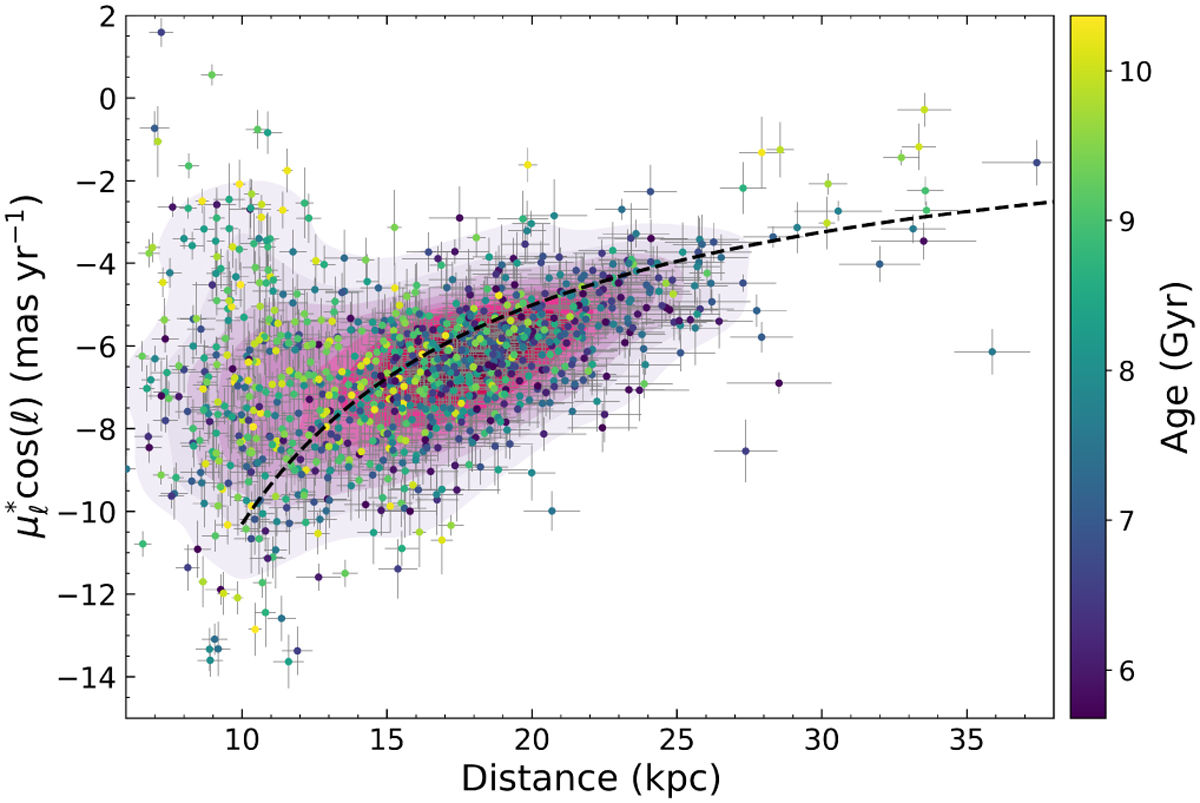
Rotation curve in proper motion space. O-rich Miras in our sample are shown as circles color-coded by age. Pink contours show the density percentiles. The dashed line represents a model of the rotation curve from Mróz et al. (2019) as seen for a line of sight through the Galactic center.
Current usage metrics show cumulative count of Article Views (full-text article views including HTML views, PDF and ePub downloads, according to the available data) and Abstracts Views on Vision4Press platform.
Data correspond to usage on the plateform after 2015. The current usage metrics is available 48-96 hours after online publication and is updated daily on week days.
Initial download of the metrics may take a while.