Fig. 13
Download original image
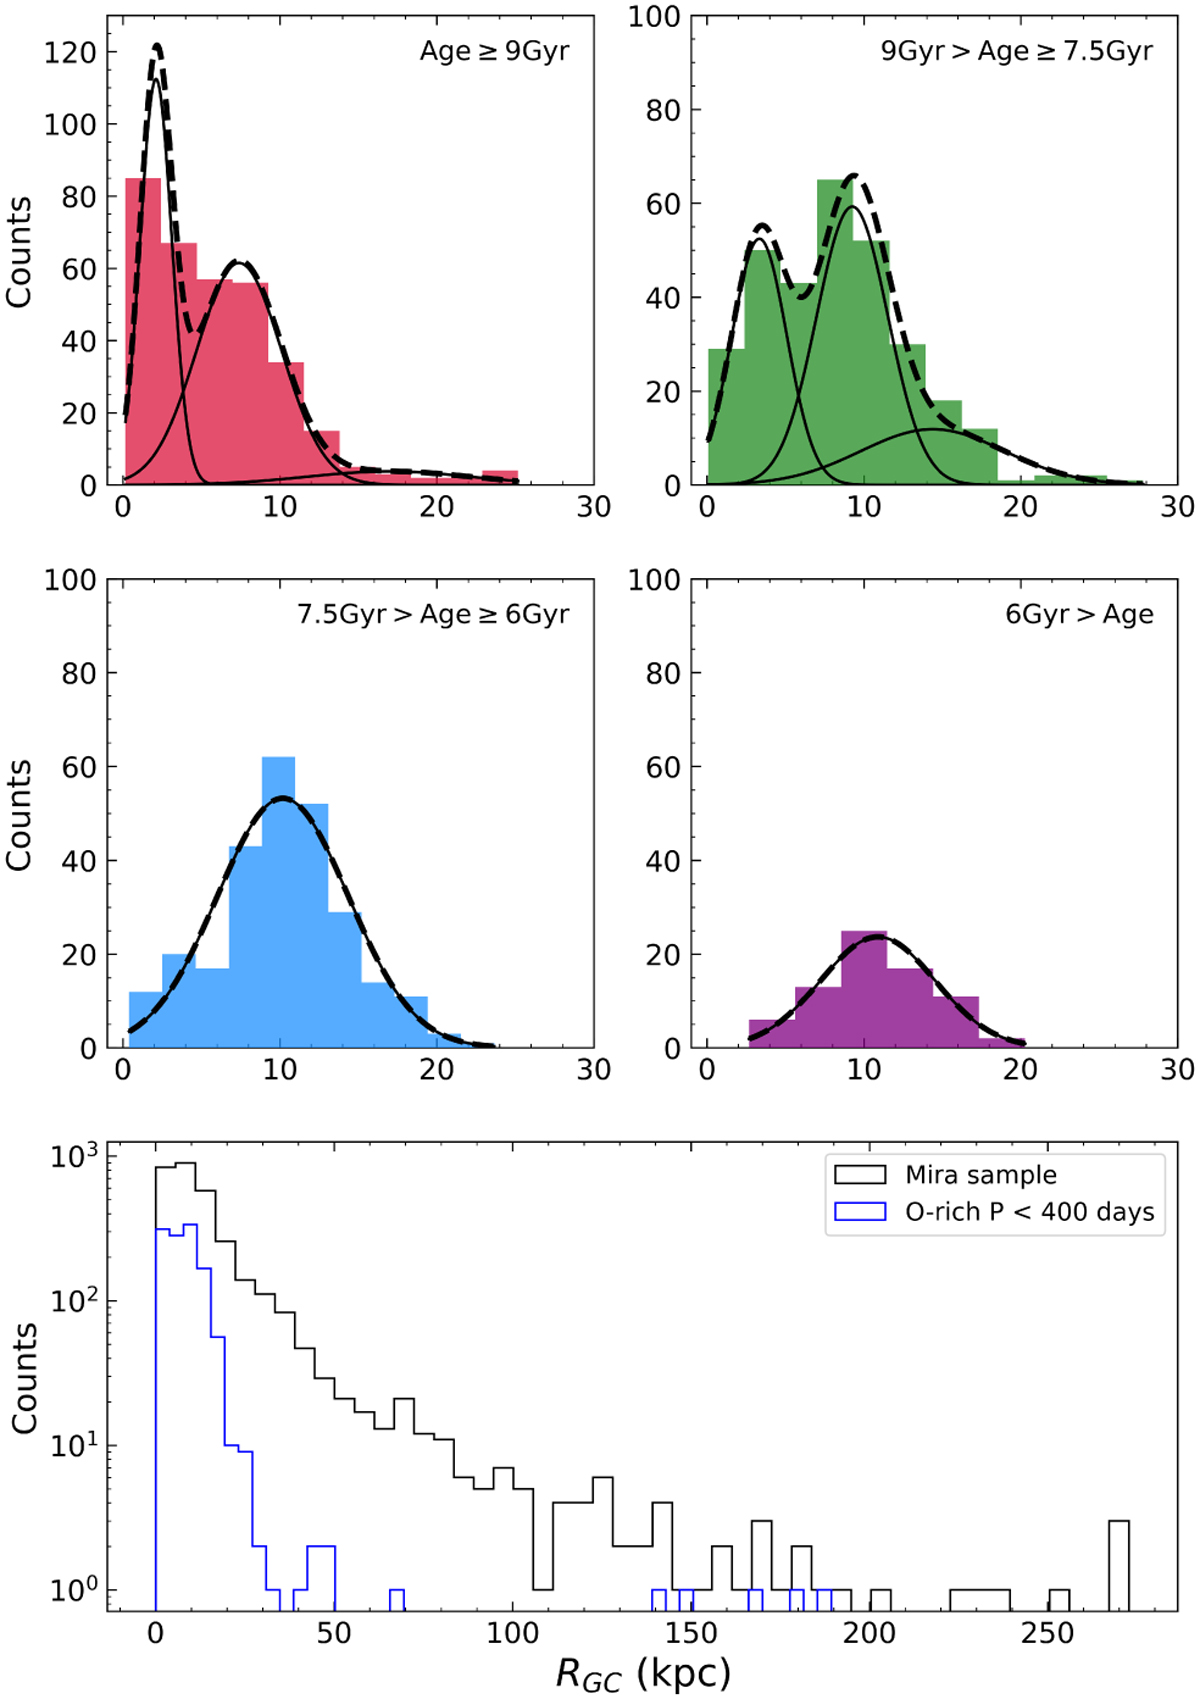
Histograms of galactocentric distance (RGC) binned by age. Top and middle panels: radius of stars in the Galaxy binned by age. The age range decreases from top to bottom and left to right. Dashed black lines represent the Gaussian mixture model fitted to the distribution. Individual components are presented as bold black lines. Bottom: full histogram of galactocentric distances for the full sample (black) and the O-rich Miras with periods under 400 days (blue).
Current usage metrics show cumulative count of Article Views (full-text article views including HTML views, PDF and ePub downloads, according to the available data) and Abstracts Views on Vision4Press platform.
Data correspond to usage on the plateform after 2015. The current usage metrics is available 48-96 hours after online publication and is updated daily on week days.
Initial download of the metrics may take a while.