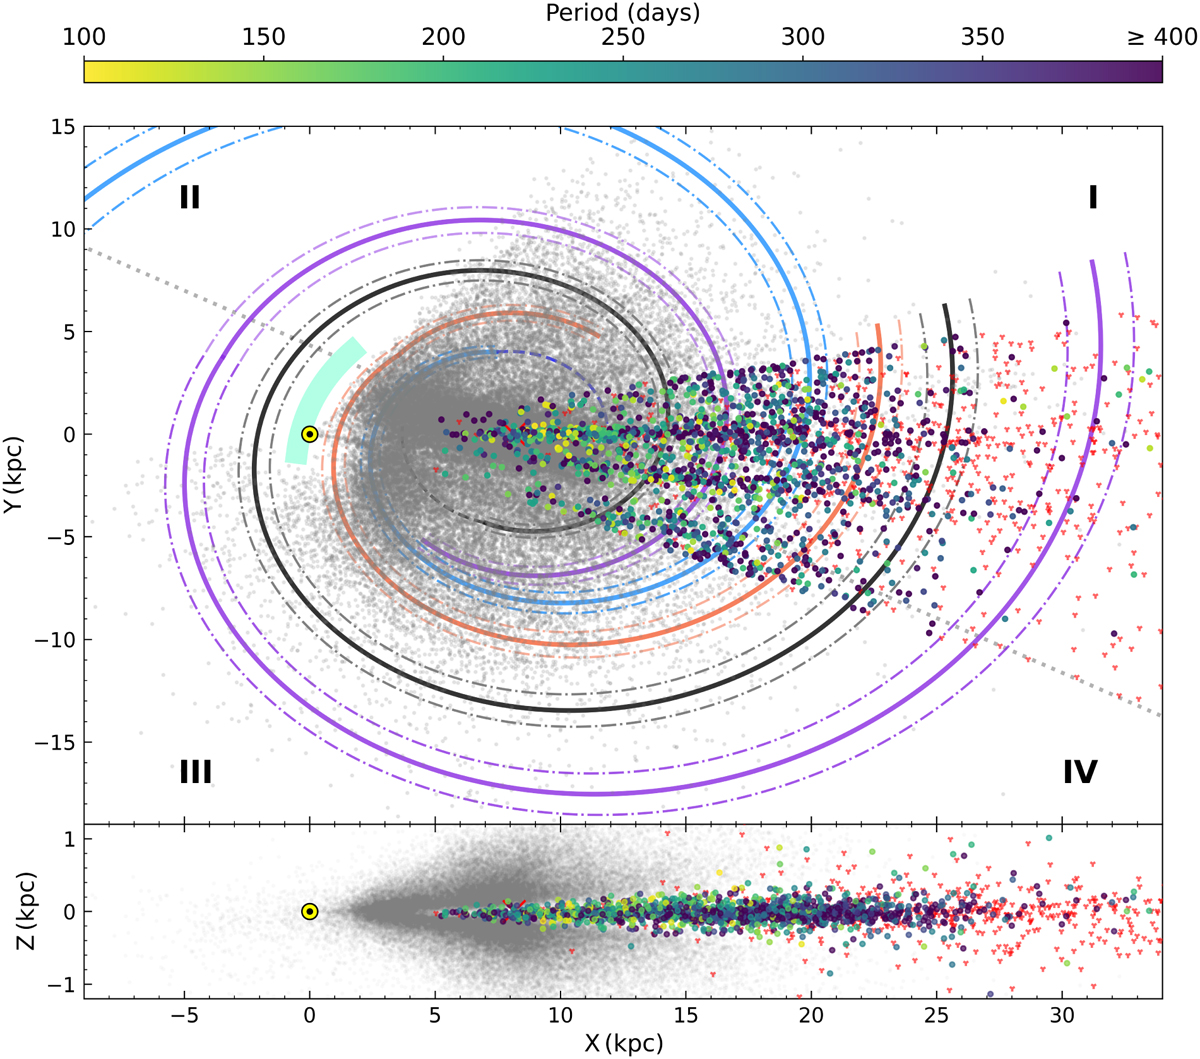
Fig. 11
Download original image
Three-dimensional distributions of Miras in the MW. The position of O-rich stars in our sample is shown in circles color-coded by period. C-rich stars are included as red ticks. We over-plot the Miras from OGLE project presented in Iwanek et al. (2022) with the distances reported in Iwanek et al. (2023) as gray dots. The Sun is located at (X, Y)=(0,0), and marked with a yellow dot, and the Galactic center is marked with a red cross at (X, Y)=(8.34,0). Log-periodic spiral arm segment fit of the local arm based on VLBI trigonometric parallaxes of high-mass star-forming regions by Reid et al. (2019) is represented with a turquoise-colored section. The thick lines represent qualitative logarithmic spiral arm fits from Minniti et al. (2021), with the thin dashed lines marking the 1σ arm widths reported in Reid et al. (2019) (Sct-Cen arm, blue; Sgr-Car arm, orange; Perseus arm, black; Outer arm, purple). The line of nodes of the Galactic warp model by Skowron et al. (2019) is also shown for reference (dotted gray line). The bottom panel shows the XZ view of the Mira distribution in the MW.
Current usage metrics show cumulative count of Article Views (full-text article views including HTML views, PDF and ePub downloads, according to the available data) and Abstracts Views on Vision4Press platform.
Data correspond to usage on the plateform after 2015. The current usage metrics is available 48-96 hours after online publication and is updated daily on week days.
Initial download of the metrics may take a while.