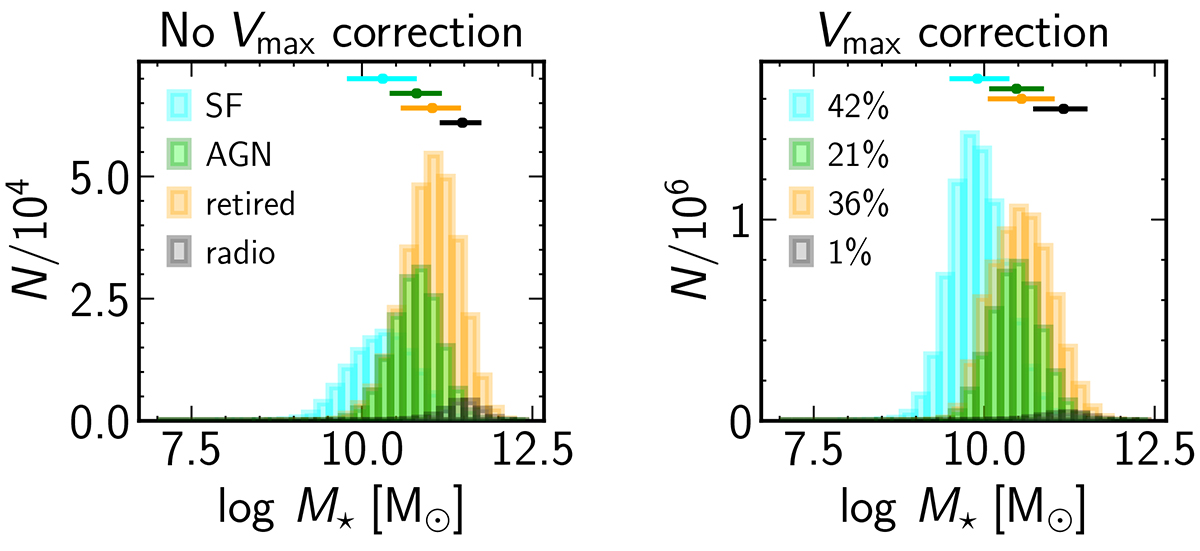
Fig. 8.
Download original image
Histograms of the distributions of SF galaxies (light blue), AGN hosts (green), retired galaxies (orange), and radio galaxies (black) in the MGSz sample. The horizontal segments show the 16–84 percentiles of each distribution, with the dot marking the median. Left: without Vmax correction; right: with Vmax correction. Percentages show the proportion of each subsample after applying the completeness correction.
Current usage metrics show cumulative count of Article Views (full-text article views including HTML views, PDF and ePub downloads, according to the available data) and Abstracts Views on Vision4Press platform.
Data correspond to usage on the plateform after 2015. The current usage metrics is available 48-96 hours after online publication and is updated daily on week days.
Initial download of the metrics may take a while.