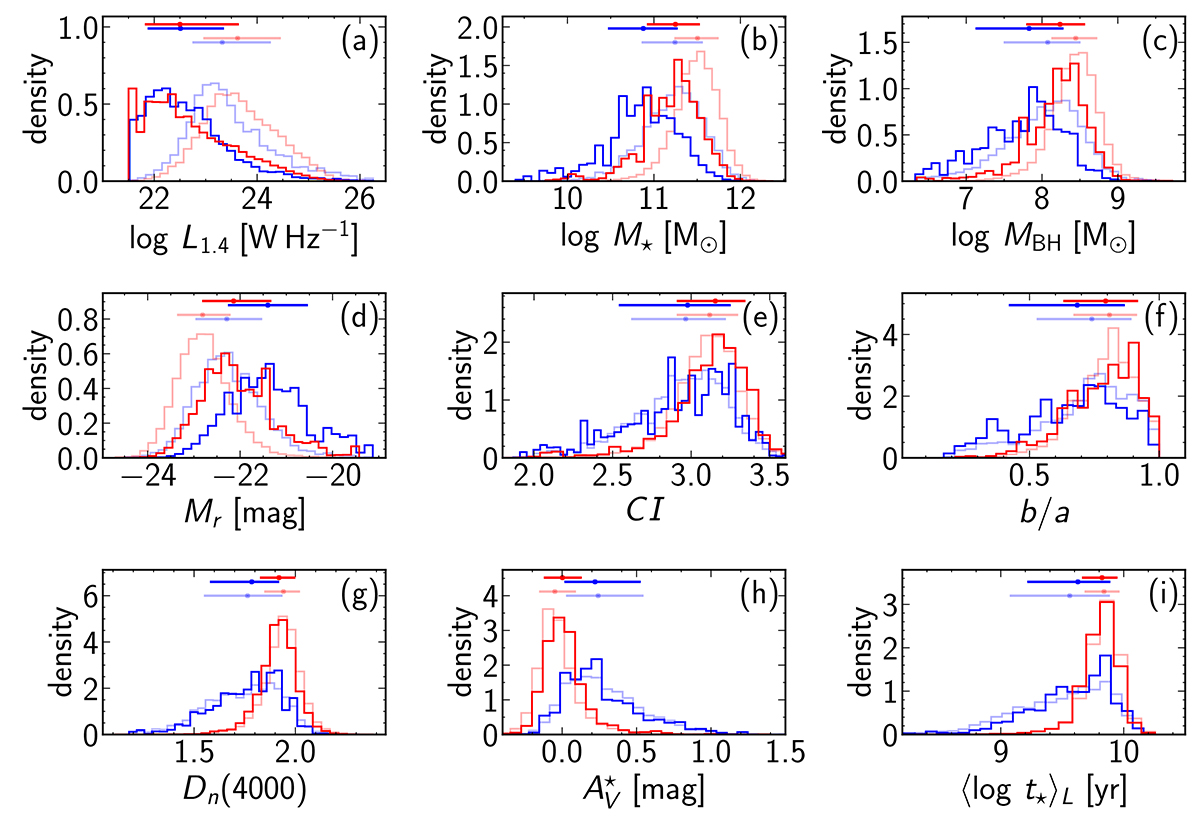
Fig. 5.
Download original image
Histograms of the distributions of various parameters in the OPARG and OPIRG samples: the radio luminosity L1.4, the total stellar mass M⋆, the black hole mass MBH, the galaxy concentration index CI, the galaxy flatness parameter b/a, the stellar extinction AV, and the mean stellar age, tL. OPARGs are shown in blue and OPIRGs in red; darker lines represent density histograms with the completeness correction, and lighter lines represent density histograms without it. The segments at the top of each panel show the 16–84 percentiles of each distribution, with the dot marking the median.
Current usage metrics show cumulative count of Article Views (full-text article views including HTML views, PDF and ePub downloads, according to the available data) and Abstracts Views on Vision4Press platform.
Data correspond to usage on the plateform after 2015. The current usage metrics is available 48-96 hours after online publication and is updated daily on week days.
Initial download of the metrics may take a while.