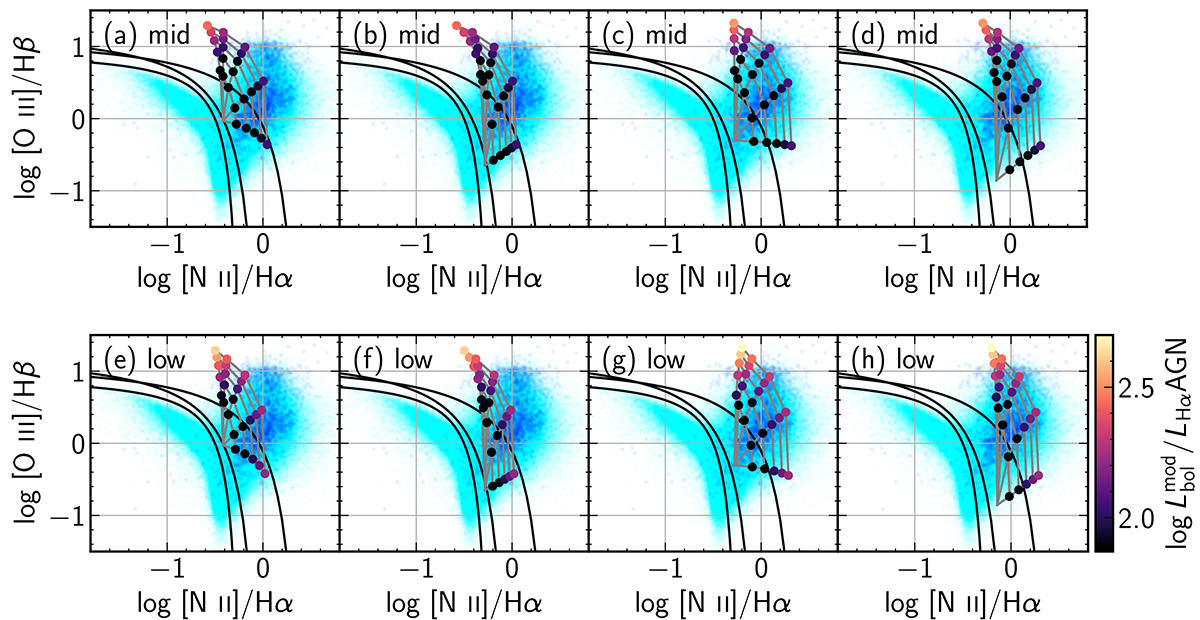
Fig. B.3.
Download original image
BPT showing the mixing lines (solid grey lines) between AGN and H II region models. Each panel is for a single H II region mixed with AGN models of a given SED (indicated on the top left) spanning all values of U from our grid of models. Points on the mixing lines mark η = 20, 40, 60, 80 and 100% and are colour-coded by the values of Lbolmod/LHα. Background points in cyan are galaxies from the MGSz sample and in blue are OPARGS galaxies; curves in black are the Stasińska et al. (2006), Kauffmann et al. (2003) and Kewley et al. (2001) lines.
Current usage metrics show cumulative count of Article Views (full-text article views including HTML views, PDF and ePub downloads, according to the available data) and Abstracts Views on Vision4Press platform.
Data correspond to usage on the plateform after 2015. The current usage metrics is available 48-96 hours after online publication and is updated daily on week days.
Initial download of the metrics may take a while.