Fig. 12.
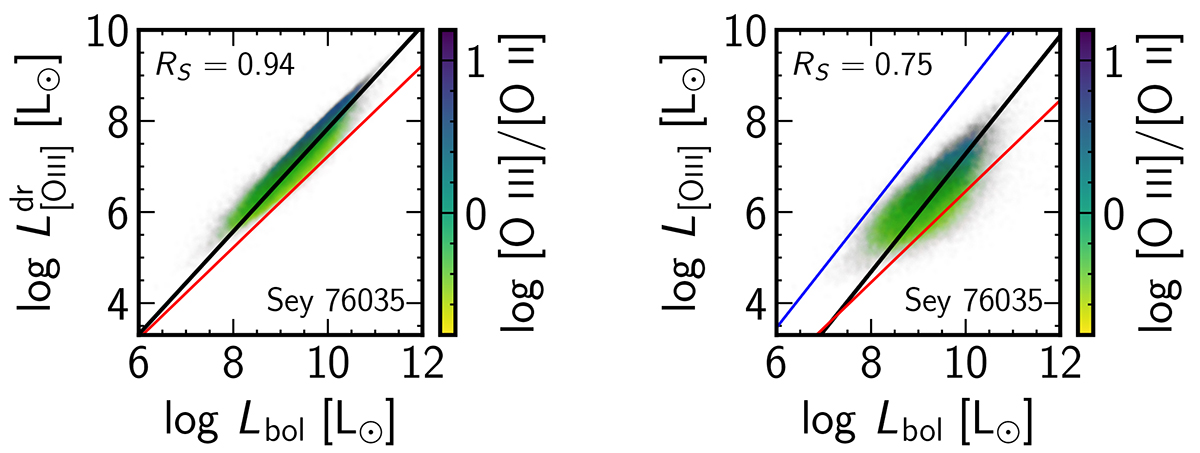
Download original image
Simple proxies for Lbol for Seyfert galaxies. Left: L[O III] corrected for extinction; right: L[O III] without extinction correction. The thick black line represents our regressions as given by Eq. (1) (left panel) and Eq. (2) (right panel) considering all 77 071 Seyferts with Lbol and L[O III] values (some which are not drawn on the panels above due to the [O II] selection cut). In the left panel the red line represents the relation of Kauffmann & Heckman (2009), while in the right panel it represents the relation from Heckman et al. (2004). The blue line in the right panel represents the relation of Spinoglio et al. (2024) for Seyfert 2 galaxies.
Current usage metrics show cumulative count of Article Views (full-text article views including HTML views, PDF and ePub downloads, according to the available data) and Abstracts Views on Vision4Press platform.
Data correspond to usage on the plateform after 2015. The current usage metrics is available 48-96 hours after online publication and is updated daily on week days.
Initial download of the metrics may take a while.