Open Access
Fig. 8.
Download original image
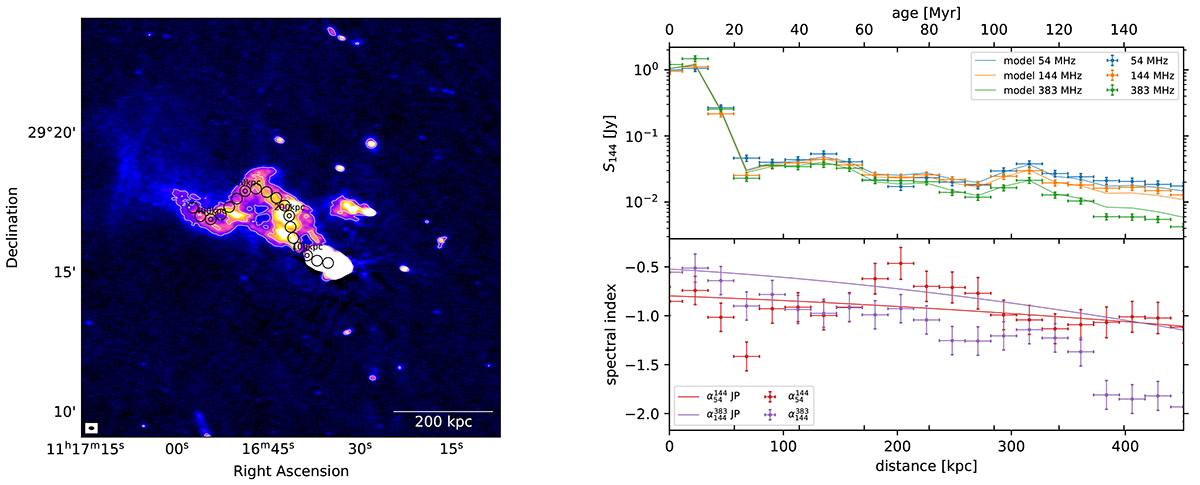
Results of the JP fit on A1213. Left: Regions from which the spectral index was sampled and fit with a JP model, overlaid on the 144 MHz map. Right: Flux density at different frequencies for each region (top) and the corresponding spectral index and the fit with a JP model (bottom).
Current usage metrics show cumulative count of Article Views (full-text article views including HTML views, PDF and ePub downloads, according to the available data) and Abstracts Views on Vision4Press platform.
Data correspond to usage on the plateform after 2015. The current usage metrics is available 48-96 hours after online publication and is updated daily on week days.
Initial download of the metrics may take a while.