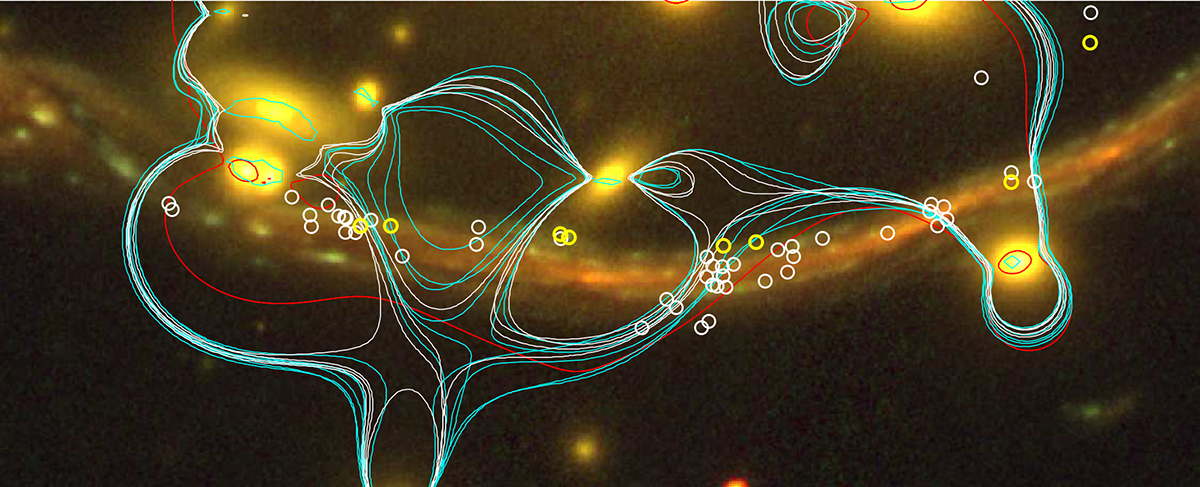
Fig. 6.
Download original image
Critical curves at z = 0.725 computed for the class of models leading to an RMS smaller than or equal to 1″, both from the N23 class of models (cyan) and from model (ii) in white. In red we plot the critical curves derived with WSLAP+. All these models use the N23 constraints. We show the location of the microlensing events reported by Fudamoto et al. (2024) as white circles and those reported by Kelly et al. (2022) in yellow.
Current usage metrics show cumulative count of Article Views (full-text article views including HTML views, PDF and ePub downloads, according to the available data) and Abstracts Views on Vision4Press platform.
Data correspond to usage on the plateform after 2015. The current usage metrics is available 48-96 hours after online publication and is updated daily on week days.
Initial download of the metrics may take a while.