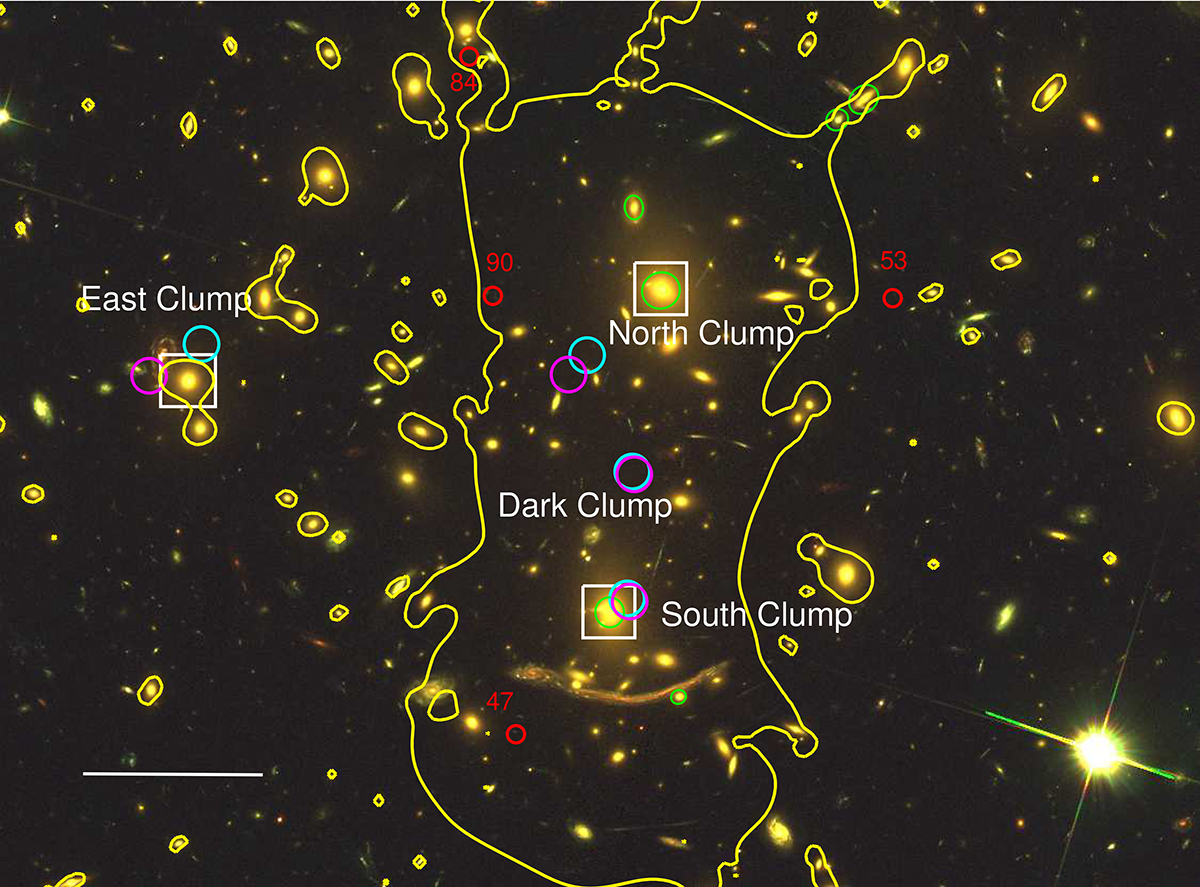
Fig. 1.
Download original image
Core of Abell 370 from BUFFALO data (F814/F606/F435 filters). The cyan circles correspond to the location of the four DM clumps from N23, and the magenta circles show their locations from model (ii) (Sect. 3.5). We draw in yellow the critical curve for z = 2 generated from model (ii). The white squares show the location of each clump in the mass model with three DM clumps (Sect. 5). The green ellipses show the cluster members that were optimised individually. We show in red the Lyman-α emitters from Claeyssens et al. (2022), for which we computed a magnification (Sect. 7). North is up, and east is left. The horizontal bar represents 20″, which corresponds to ∼100 kpc at the redshift of Abell 370.
Current usage metrics show cumulative count of Article Views (full-text article views including HTML views, PDF and ePub downloads, according to the available data) and Abstracts Views on Vision4Press platform.
Data correspond to usage on the plateform after 2015. The current usage metrics is available 48-96 hours after online publication and is updated daily on week days.
Initial download of the metrics may take a while.