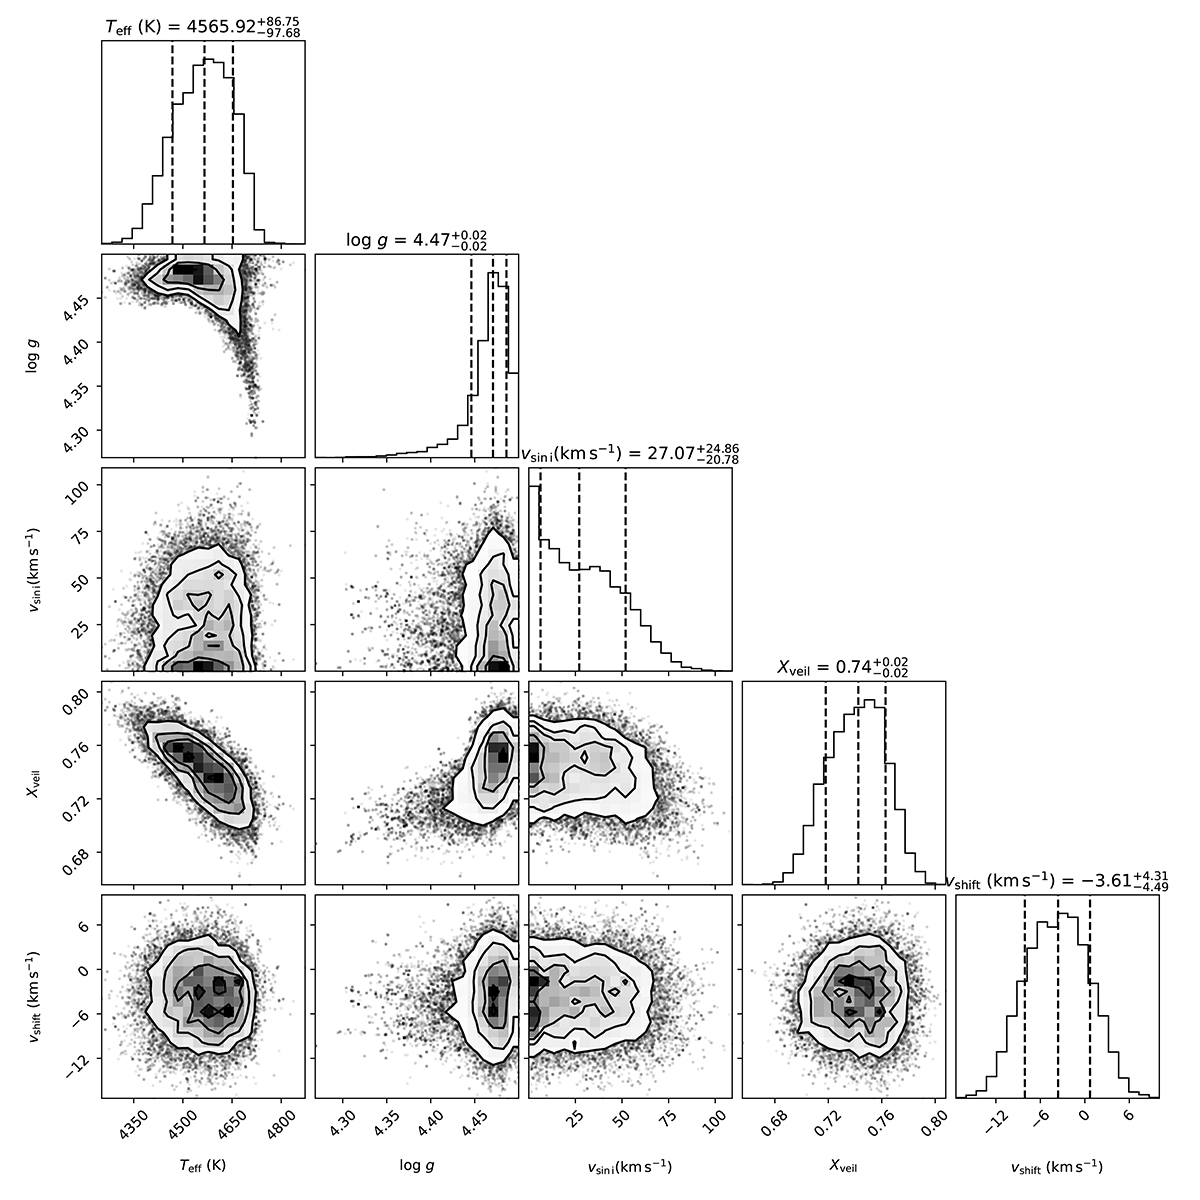
Fig. A.1.
Download original image
Corner plot for the free parameters of the EMCEE spectral classification. Contours in the 2D plots correspond to the 0.5σ, 1σ, 1.5σ, and 2.5σ levels (respectively containing 11.8, 39.3, 67.5, and 86.5 % of the volume), while in the marginalised 1D distributions the 0.16, 0.50, and 0.84 quantiles are marked with dashed lines.
Current usage metrics show cumulative count of Article Views (full-text article views including HTML views, PDF and ePub downloads, according to the available data) and Abstracts Views on Vision4Press platform.
Data correspond to usage on the plateform after 2015. The current usage metrics is available 48-96 hours after online publication and is updated daily on week days.
Initial download of the metrics may take a while.