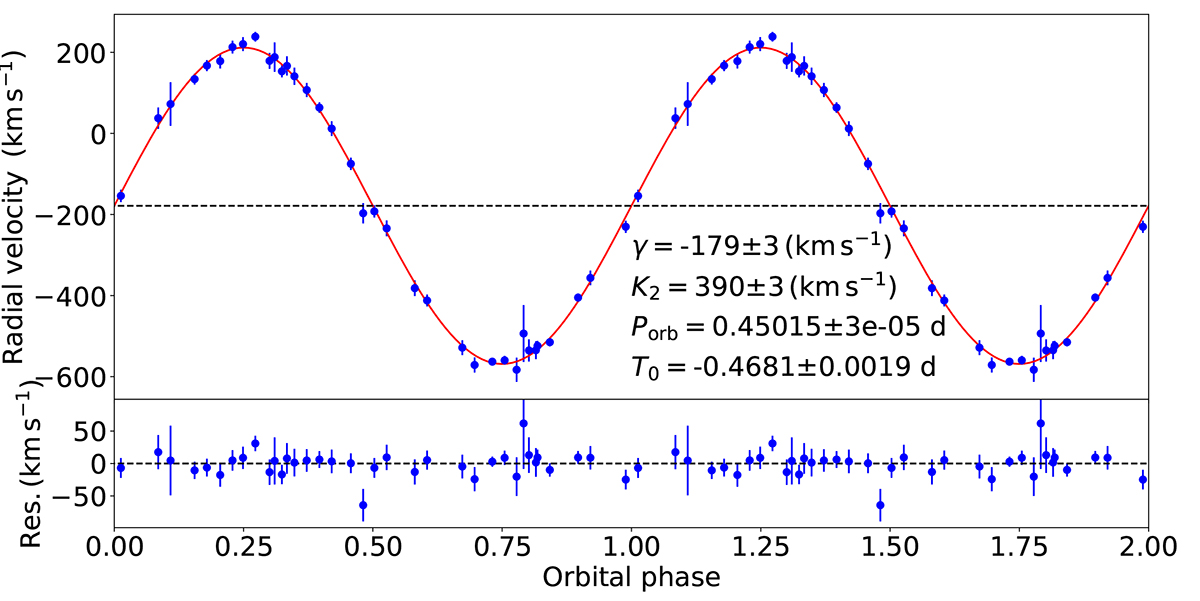
Fig. 3.
Download original image
Radial velocity curve of the companion star in J1727 measured through cross-correlation with the template star HD219134 (K3/4V), and folded to the best-fit ephemerides. We repeated two orbital phases for visualisation purposes. The top panel shows the individual radial velocities (blue dots), as well as the best fit sinusoid (solid red line). The best-fitting parameters are also reported in this panel. The bottom panel shows the residuals from the best fit.
Current usage metrics show cumulative count of Article Views (full-text article views including HTML views, PDF and ePub downloads, according to the available data) and Abstracts Views on Vision4Press platform.
Data correspond to usage on the plateform after 2015. The current usage metrics is available 48-96 hours after online publication and is updated daily on week days.
Initial download of the metrics may take a while.